

Guest blogger Brett Marmo, technical director of Xi Engineering, discusses using acoustics simulation to analyze the impact of tidal turbines on harbor seals.
Creating clean energy alternatives for energy sources that generate greenhouse gas is crucial if we are to avoid excessive global heating and the rising climate crisis. A viable, renewable energy source are ocean tides, which, unlike solar and wind resources, are not weather dependent, making them predictable. Tidal energy can be harnessed by deploying tidal turbines into tidal streams. This process is the foundation of the MeyGen project, a massive renewable energy project that is planned to be the world’s largest tidal energy plant. Recently, an array of tidal turbines has been deployed at this project site, where tides flowing between the Atlantic Ocean and North Sea are funneled into a high-energy stream between mainland Scotland and the Island of Stroma.
A Goldilocks Approach to Tidal Turbine Design
While curbing greenhouse gas emissions is important to the wellbeing of the earth, it must be done in a manner that does not have other detrimental environmental impacts. In the case of tidal turbines, environmental impacts may include the risk of injury to marine species, such as collision with a turbine’s moving parts or high levels of operational noise. There is a “Goldilocks” noise level of operational noise that turbines produce; it’s desirable that the level be loud enough to warn marine species of the presence of the turbine to allow them to avoid collision, while being not so loud to cause them injury.
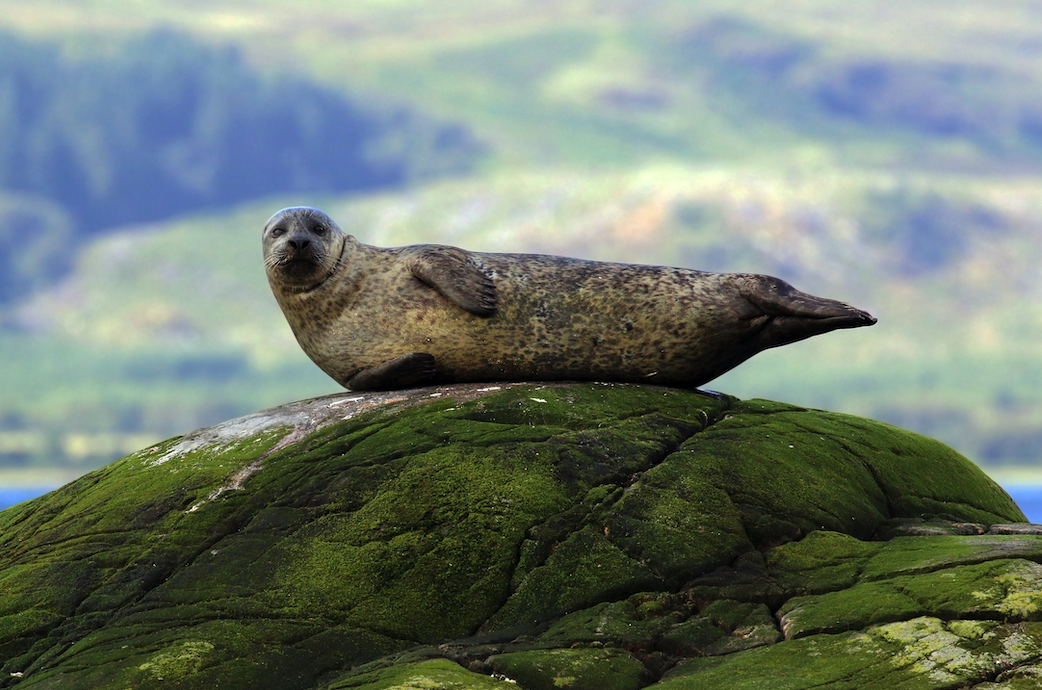
Figure 1. A harbor seal, one of the marine species impacted by tidal turbine designs. Image licensed under CC BY-SA 4.0, via Wikimedia Commons.
Xi has previously used the COMSOL Multiphysics® software to estimate the likely noise level generated by tidal turbines before they were deployed into the ocean and subjected marine life to their presence. Recent underwater noise measurements of the MeyGen project, collected by the Scottish Association of Marine Science (SAMS), provide an opportunity to validate these models. The models were then used to generate spatial and temporal three-dimensional noise maps, which have been compared by SAMS to their data on the movement and behavior of harbor seals and porpoises for a better understanding of how marine mammals interact with these clean-energy-producing devices. Harbor seals are the main focus of this research because the population that inhabits the area near the MeyGen project site has significantly declined over the past few decades; therefore, the MeyGen project is taking particular care not to adversely affect them.
What Do Tidal Turbines Sound Like?
Tidal turbines have similar layouts to horizontal-axis wind turbines, with a rotor consisting of three blades connected via a hub and a drive shaft (Figure 2). The rotation speed of the rotor uses a step-up gearbox to convert electrical energy with a generator. The energy is then exported by underwater cables to the onshore grid.
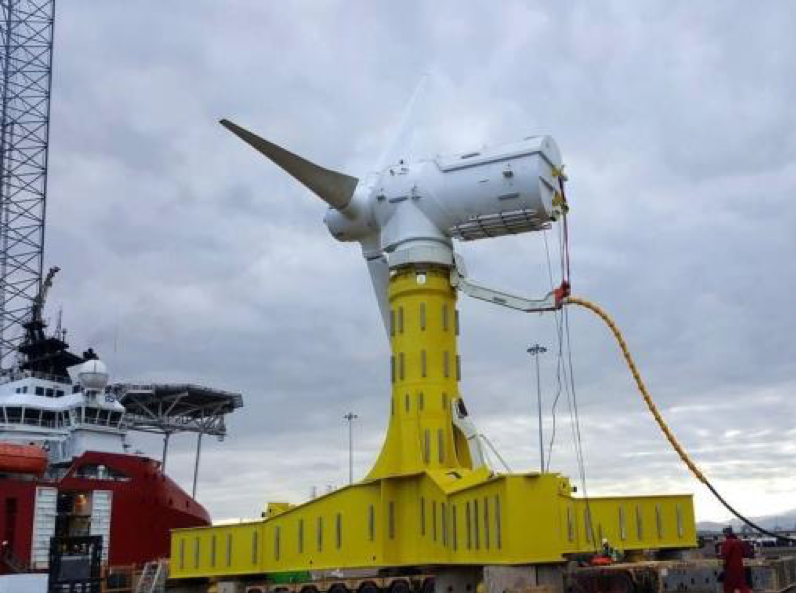
Figure 2. A tidal turbine waiting dockside for deployment at the MeyGen project.
Mechanical noise from tidal turbines is a result of vibrations from their gearboxes and generators. Commonly, the highest levels of tonal noise are produced by the meshing of teeth in the gearbox. Typically, gearboxes have three step-up stages — the low-speed stage, intermediate stage, and high-speed stage — which produce tonal vibrations ranging between 10–30 Hz, 80–150 Hz, and 200–1000 Hz, respectively. A second source of vibration is produced from cogging forces in the generator, which are caused by interactions between the magnets and coils as they pass each other, these vibrations are around 500 Hz to 2 kHz. The vibration in the drivetrain travel through the turbine structure to the blades, nacelle walls, and support structures, where they interact with the surrounding water and radiate away as tonal noise (Figure 3).
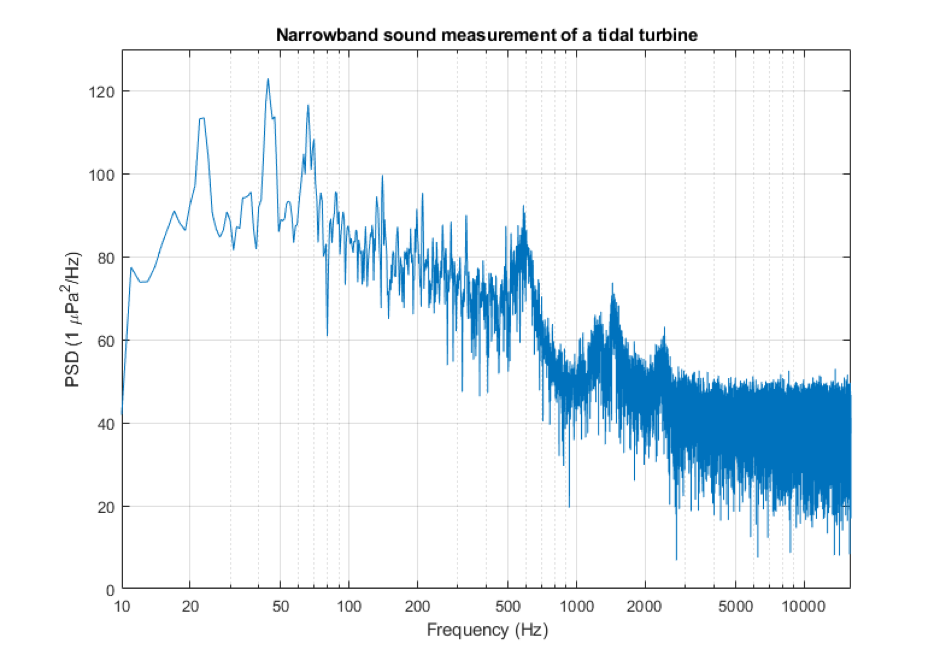
Figure 3. Underwater sound pressure spectral density measured 200 m from an Andritz Hydro Hammerfest tidal turbine.
How Was COMSOL Multiphysics® Used?
Modeling the cumulative noise from an array of tidal turbines presents a simulation challenge due to the size difference of the turbines where noise is generated (tens of meters) and the volume of water over which the noise impacts marine species (kilometers). It’s possible to resolve the noise field around a single turbine using a finite element mesh. However, a mesh that would cover the volume of water that would affect the animals is far too large to be tractable, so a geometric acoustics approach must be used.
The acoustic output of the tidal turbine was modeled with COMSOL Multiphysics by coupling the Pressure Acoustics, Frequency Domain and Structural Mechanics interfaces. The turbine was represented by solid and shell elements and the drivetrain was excited using body loads based on Xi’s measurements of equivalent gearboxes and generators in wind turbines. The structural domain was fully coupled with an acoustics domain to represent the surrounding water (Figure 4). The water was modeled as a hemisphere with a perfectly matched layer to allow acoustic energy to leave the model space, while the far-field radiation pattern was calculated using the Exterior Field Calculation feature. The team solved the model in the frequency domain.

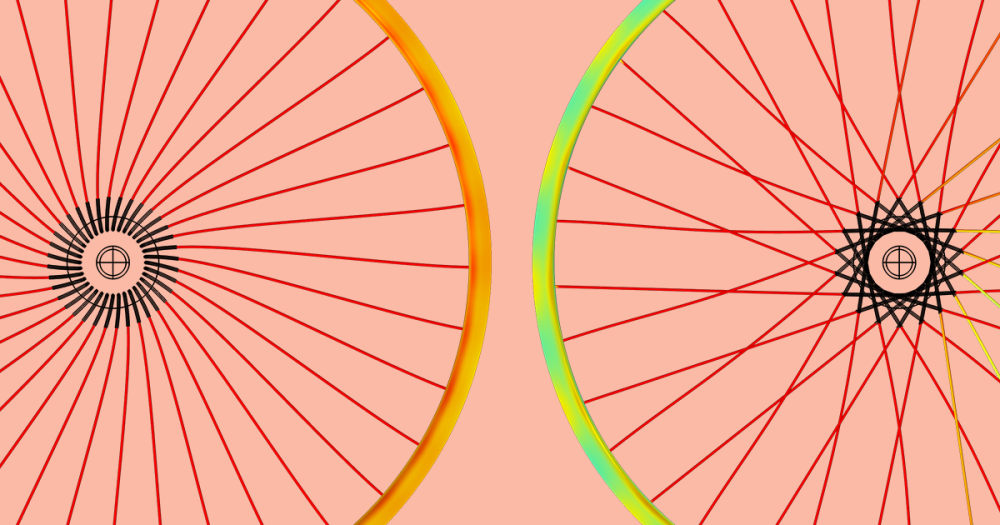
Figure 4. Sound field produced by a single turbine at 250 Hz, modeled with a coupled structural-acoustic model. An Exterior Field Calculation feature is used at the outer end of the hemisphere. The model includes a perfectly match layer that is not shown here.
The model included a second component where the ocean between mainland Scotland and the Island of Stroma was modeled using the Ray Acoustics interface (Figure 5). The geometry was based on the bathymetry of the ocean floor and the seabed was given appropriate acoustic impedance conditions, while the sea surface was assumed to be a perfect reflector. The model was populated with noise sources using Release from Exterior Field Calculation, whereby the results from the noise field around an individual turbine can be directly imported into the model at the correct spatial position. The use of Exterior Field Calculation means that the directionality of the noise field around the turbine is included in the ray acoustics model.

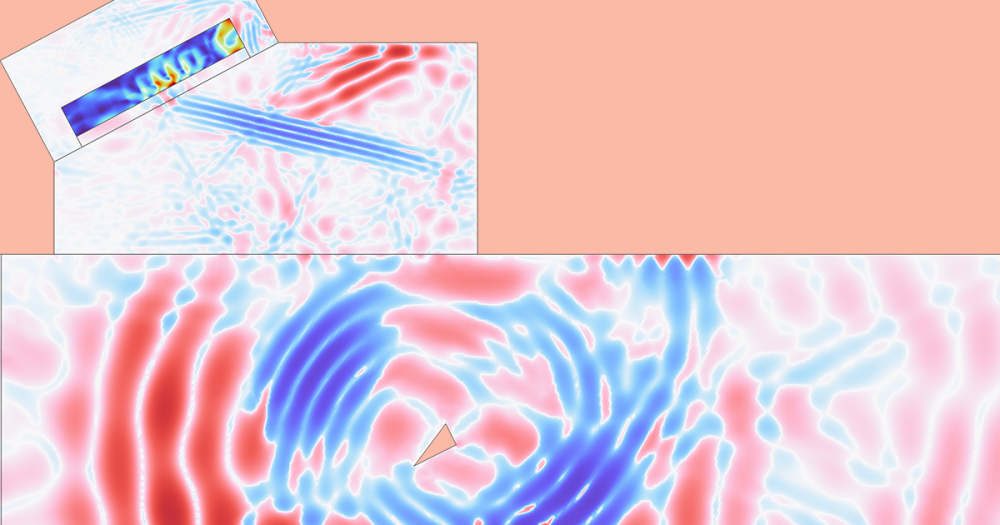
Figure 5. Ray acoustic model of operational noise from four turbines at 250 Hz. The sound pressure level is shown for a horizontal section 10 m below the sea surface.
Sound Fields and Their Impact on Seals
SAMS deployed drifting hydrophones in 2020 to measure the operational noise produced by one of the tidal turbines from the MeyGen project at a range of distances, going up to 1400 m from the tidal turbine. These data were used to validate the models (Figure 6).

Figure 6. Comparison of measurements and modeled one-third octave levels of underwater noise from a tidal turbine operating at maximum power output. Measurement points 100 m and 1000 m from the operational turbine are shown. Error bars show the one standard deviation of measured underwater noise for each levels’ one-third octave band.
Multiphysics modeling was then used to determine the spatial sound pressure levels for each three-octave band between 20 Hz and 2 kHz. To determine the impact on marine mammals, the sound level as a function of frequency is m-weighted for the hearing thresholds of individual species; this is equivalent to an A-weighted curve for human hearing. The modeling results were m-weighted for harbor seals and collated in MATLAB® to create noise maps, which proved that the operational noise levels were below those that might cause harbor seals harm. Additionally, the noise map showcased that even when the turbines’ operational noise expanded hundreds of meters, it was above ambient background noise. Therefore, seals are able to detect the presence of the turbines and avoid contact with them. The operational noise from these turbines are within the sound level Goldilocks zone for harbor seals.

Figure 7. Cumulative sound pressure level from the operational tidal array weighted for the hearing of harbor seals. The levels are below what would be harmful to seals.
Looking to the Future
The sound maps produced with COMSOL Multiphysics are currently being integrated with seal tracking data to determine how the acoustic output affects the animals. Collecting underwater acoustic data is extremely difficult in such a high-energy environment, where tidal currents reach 3 m/s. The spatial fidelity of the sound field required to make comparisons with tracking data is not possible using measurement alone; the modeling discussed here has provided the required fidelity and given marine scientists a valuable tool for understanding how tidal turbines affect the natural world.
The MeyGen project has plans to deploy more tidal turbines and increase the amount of clean energy that it can provide. Using modeling and simulation will allow for the rapid assessment of the cumulative noise that is produced by the increasingly large array and will help marine scientists determine the placement of turbines with consideration to the impact of marine species. The COMSOL Multiphysics simulations provided by Xi, integrated with the acoustic and tracking data collected by SAMS, are helping to deploy clean marine energy systems that are beneficial to humans and safe for animals living in a marine environment.
About the Author
Dr. Brett Marmo is the technical director of Xi Engineering Consultants. He has more than 25 years of experience in modeling dynamics, starting with his work on Antarctic glaciers, for which he received his PhD from the University of Melbourne. He is a long-time user of COMSOL Multiphysics and began working with the software during his postdoctoral work at the University of Edinburgh. He has been employed by Xi Engineering since 2006, where he has formed a modeling team who are accredited with Certified COMSOL Consultant status. At Xi, he has modeled a wide range of applications, from optimizing the acoustic performance of electrostatic speakers to analyzing the stability of warehouse-scale delivery systems when exposed to earthquakes.
MATLAB is a registered trademark of The MathWorks, Inc.

Comments (0)