ビデオギャラリ
特集ビデオ
再生時間: 9:58
Xi Engineering Demos How to Access Apps via COMSOL Server™
Watch this video to see Xi Engineering, a COMSOL Certified Consultant, present one of several simulation applications they have created with the Application Builder. They demonstrate how to access, ...
再生時間: 16:23
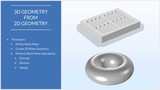
How to Build 3D Objects from 2D Geometries in COMSOL Multiphysics®
When creating a model, one of the first steps you must take is to build the geometry. COMSOL Multiphysics® contains a plethora of geometry tools, operations, and other functionality that ...
再生時間: 26:10
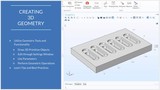
Using the 3D Geometry Tools in COMSOL Multiphysics®
One of the first steps to building a model is creating the geometry. To help you build 3D geometries, COMSOL Multiphysics® contains a number of geometry tools, operations, and other ...

再生時間: 25:42
Using Selections to Streamline Your COMSOL Multiphysics Modeling Workflow
In this tutorial video series, you will learn how to use all of the named selection tools available in the COMSOL Multiphysics simulation software. Named selections include Explicit, Coordinate ...
再生時間: 16:02
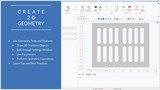
Creating 2D Geometries in COMSOL Multiphysics®
When creating a model, one of the first steps you must complete is building the geometry. In COMSOL Multiphysics®, you can build 2D geometries by using any of the geometry operations, ...

再生時間: 21:13
Keynote: Predicting Leak Locations in Pipes with Simulation
In his keynote talk at the COMSOL Conference 2016 Boston, Sebastien Perrier of Echologics Engineering shares how he used COMSOL Multiphysics® to model the sound propagation in buried pipe ...

再生時間: 24:42
Keynote: Advancing Multiphysics Analysis with Simulation Apps
In his keynote talk at the COMSOL Conference 2016 Boston, Ed Furlani from University at Buffalo (UB) SUNY discusses how he uses the COMSOL Multiphysics® software for everything from ...

再生時間: 25:17
Keynote: Leveraging Modeling and First Principles Thinking
In his keynote talk at the COMSOL Conference 2016 Boston, Bernard McGarvey of Eli Lilly and Company shares how he leverages both modeling in COMSOL Multiphysics® and "first principles" ...

再生時間: 24:08
Keynote: Transport Processes in Microfluidics and Photonics
In his keynote talk at the COMSOL Conference 2016 Boston, Carl Meinhart from the University of California - Santa Barbara and Numerical Design, Inc. discusses using COMSOL Multiphysics® to ...
再生時間: 4:30
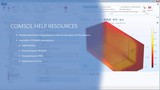
Using the Help Tools and Resources in COMSOL Multiphysics®
COMSOL Multiphysics® contains several tools and resources to help you as you are modeling in the software. Some of these resources can be accessed right within COMSOL Desktop® as ...
再生時間: 3:30
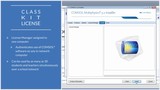
Install the COMSOL Multiphysics® License Manager with a Class Kit License
With the Class Kit License, up to 30 teachers and students can run COMSOL Multiphysics® for classroom purposes over the school’s network where they access the license on-campus or through a ...
再生時間: 11:12
Create and Export Animations from COMSOL Multiphysics®
Showing visually engaging animations can be extremely valuable when conveying the results of your COMSOL Multiphysics® model. Whether you are showing your results in a presentation, on the ...
再生時間: 2:59
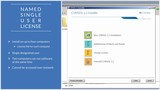
Installing COMSOL Multiphysics® with a Named Single User License
If you want to learn how to install the COMSOL Multiphysics® simulation software with a Named Single User License (NSL), watch this tutorial video. A Named Single User License enables you ...

再生時間: 32:45
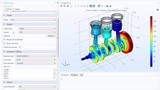
Using Plots to Visualize Results in COMSOL Multiphysics®
Watch this video series to learn how to create some of the most frequently used plot types in COMSOL Multiphysics®. Each video shows a step-by-step demonstration of how to create certain ...

再生時間: 2:26
Updating Your COMSOL® Software Network License File
If you have a Floating Network License, Class Kit License, COMSOL Server License, or Academic Server License and need to update your license file, this video will show you how. You need to update ...
再生時間: 9:58
Xi Engineering Demos How to Access Apps via COMSOL Server™
Watch this video to see Xi Engineering, a COMSOL Certified Consultant, present one of several simulation applications they have created with the Application Builder. They ...
再生時間: 16:23
How to Build 3D Objects from 2D Geometries in COMSOL Multiphysics®
When creating a model, one of the first steps you must take is to build the geometry. COMSOL Multiphysics® contains a plethora of geometry tools, operations, and other functionality that provide you with a ...
再生時間: 26:10
Using the 3D Geometry Tools in COMSOL Multiphysics®
One of the first steps to building a model is creating the geometry. To help you build 3D geometries, COMSOL Multiphysics® contains a number of geometry tools, operations, and other functionality. This ...
再生時間: 25:42
Using Selections to Streamline Your COMSOL Multiphysics Modeling Workflow
In this tutorial video series, you will learn how to use all of the named selection tools available in the COMSOL Multiphysics simulation software.
Named selections include Explicit, Coordinate ...
再生時間: 16:02
Creating 2D Geometries in COMSOL Multiphysics®
When creating a model, one of the first steps you must complete is building the geometry. In COMSOL Multiphysics®, you can build 2D geometries by using any of the geometry operations, tools, and other ...
再生時間: 21:13
Keynote: Predicting Leak Locations in Pipes with Simulation
In his keynote talk at the COMSOL Conference 2016 Boston, Sebastien Perrier of Echologics Engineering shares how he used COMSOL Multiphysics® to model the sound propagation in buried pipe infrastructures to ...
再生時間: 24:42
Keynote: Advancing Multiphysics Analysis with Simulation Apps
In his keynote talk at the COMSOL Conference 2016 Boston, Ed Furlani from University at Buffalo (UB) SUNY discusses how he uses the COMSOL Multiphysics® software for everything from understanding physical ...
再生時間: 25:17
Keynote: Leveraging Modeling and First Principles Thinking
In his keynote talk at the COMSOL Conference 2016 Boston, Bernard McGarvey of Eli Lilly and Company shares how he leverages both modeling in COMSOL Multiphysics® and "first principles" thinking to improve ...
再生時間: 24:08
Keynote: Transport Processes in Microfluidics and Photonics
In his keynote talk at the COMSOL Conference 2016 Boston, Carl Meinhart from the University of California - Santa Barbara and Numerical Design, Inc. discusses using COMSOL Multiphysics® to evaluate ...
再生時間: 4:30
Using the Help Tools and Resources in COMSOL Multiphysics®
COMSOL Multiphysics® contains several tools and resources to help you as you are modeling in the software. Some of these resources can be accessed right within COMSOL Desktop® as well as locally on your ...
再生時間: 3:30
Install the COMSOL Multiphysics® License Manager with a Class Kit License
With the Class Kit License, up to 30 teachers and students can run COMSOL Multiphysics® for classroom purposes over the school’s network where they access the license on-campus or through a secure remote ...
再生時間: 11:12
Create and Export Animations from COMSOL Multiphysics®
Showing visually engaging animations can be extremely valuable when conveying the results of your COMSOL Multiphysics® model. Whether you are showing your results in a presentation, on the web, or as a ...
再生時間: 2:59
Installing COMSOL Multiphysics® with a Named Single User License
If you want to learn how to install the COMSOL Multiphysics® simulation software with a Named Single User License (NSL), watch this tutorial video.
A Named Single User License enables you to install the { ...
再生時間: 32:45
Using Plots to Visualize Results in COMSOL Multiphysics®
Watch this video series to learn how to create some of the most frequently used plot types in COMSOL Multiphysics®. Each video shows a step-by-step demonstration of how to create certain plot types and the ...
再生時間: 2:26
Updating Your COMSOL® Software Network License File
If you have a Floating Network License, Class Kit License, COMSOL Server License, or Academic Server License and need to update your license file, this video will show you how.
You need to update ...