Video Gallery
特集ビデオ
再生時間: 5:13
Chapter 3: Advanced Visualization Techniques in Postprocessing
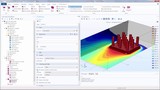
Tutorial on how to view the simulation results of a model with periodicity over an area extending beyond that of the original geometry, creating a more intuitive visualization for a periodic model. ...

再生時間: 8:57
Chapter 2: Advanced Visualization Techniques in Postprocessing
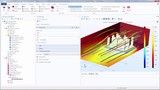
Learn how to create a plot using the Mirror, Extrusion, and Sector Data Sets to visualize the results from a model with symmetry. A demonstration is also given of how to chain together data sets to ...

再生時間: 7:11
Chapter 1: Advanced Visualization Techniques in Postprocessing
This video shows how to use a Revolution Data Set to create a full 3D plot of an axisymmetric simulation; plot types demonstrated include Isosurface, Volume, and Contour. This is Chapter 1 of 3 in ...
再生時間: 1:02
Visualize a Model's Mesh and Solution in One Plot
This tutorial video shows you how you can visualize any model's mesh and solution in a single plot in COMSOL Multiphysics®. Note that this capability is available for any results that are ...
再生時間: 1:50
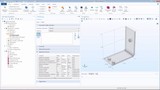
Creating and Exporting Model Reports in COMSOL Multiphysics®
In COMSOL Multiphysics®, you can use the COMSOL Report Generator to create a comprehensive report of an entire model and this tutorial video demonstrates how. Your report can include all ...
再生時間: 3:53
Postprocessing the Results from a Parametric Sweep
After running a COMSOL Multiphysics simulation that yields multiple results, there are specific ways to postprocess the data. Using a simple parametric sweep study, we show you how to tabulate your ...
再生時間: 3:22
How to Import Results Data into COMSOL Multiphysics
When a simulation has numerous data points, you can compare your results with reference or experimental data directly within the COMSOL Multiphysics graphical user interface. In this video, we ...
再生時間: 8:06
How to Use Surface, Volume, and Line Plots to Visualize Your Results
COMSOL Multiphysics® contains many tools for postprocessing and visualizing your simulation results. Among the many plot types available are Surface, Line, and Volume plots. Surface plots are used ...
再生時間: 5:05
How to Use Arrow Plots to Visualize Your Results
Arrow plots are a powerful postprocessing tool used to visualize field distributions in COMSOL Multiphysics®. This is useful for fluid flow, electricity and magnetism, chemical, and heat ...
再生時間: 6:31
How to Use Slice Plots to Visualize Your Results
Slice plots are a postprocessing tool that can be applied to your COMSOL Multiphysics simulations that are modeled in 3D. You can use a Slice plot to display a quantity on one or more cross ...
再生時間: 7:11
How to Use Contour and Isosurface Plots to Visualize Results
Contour and Isosurface plots are used in postprocessing to visualize scalar quantities and fields in your simulation results. Contour plots display your results on a series of colored regions or ...
再生時間: 5:02
How to Use Streamline Plots to Visualize Your Results
Streamline plots are a postprocessing tool in COMSOL Multiphysics® that can be applied to the results of 2D and 3D models. You can use a Streamline plot to display a vector quantity, which is ...
再生時間: 5:39
Using the Graphics Window to Customize Model Visualizations
In COMSOL Multiphysics®, the Graphics window provides you with interactive graphics for the geometry, mesh, and results of your model. In addition, the Graphics window toolbar provides you ...
再生時間: 1:01:49
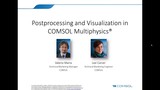
Postprocessing and Visualizing COMSOL Simulation Results
In this archived webinar, learn how to postprocess and analyze your numerical simulation results in COMSOL Multiphysics®. We demonstrate how to evaluate data along lines and surfaces; ...

再生時間: 32:45
Using Plots to Visualize Results in COMSOL Multiphysics®
Watch this video series to learn how to create some of the most frequently used plot types in COMSOL Multiphysics®. Each video shows a step-by-step demonstration of how to create certain ...
再生時間: 5:13
Chapter 3: Advanced Visualization Techniques in Postprocessing
Tutorial on how to view the simulation results of a model with periodicity over an area extending beyond that of the original geometry, creating a more intuitive visualization for a periodic model. ...
再生時間: 8:57
Chapter 2: Advanced Visualization Techniques in Postprocessing
Learn how to create a plot using the Mirror, Extrusion, and Sector Data Sets to visualize the results from a model with symmetry. A demonstration is also given of how to chain together data sets to ...
再生時間: 7:11
Chapter 1: Advanced Visualization Techniques in Postprocessing
This video shows how to use a Revolution Data Set to create a full 3D plot of an axisymmetric simulation; plot types demonstrated include Isosurface, Volume, and Contour. This is Chapter 1 of 3 in ...
再生時間: 1:02
Visualize a Model's Mesh and Solution in One Plot
This tutorial video shows you how you can visualize any model's mesh and solution in a single plot in COMSOL Multiphysics®. Note that this capability is available for any results that are contained in 3D or ...
再生時間: 1:50
Creating and Exporting Model Reports in COMSOL Multiphysics®
In COMSOL Multiphysics®, you can use the COMSOL Report Generator to create a comprehensive report of an entire model and this tutorial video demonstrates how.
Your report can include all of the settings ...
再生時間: 3:53
Postprocessing the Results from a Parametric Sweep
After running a COMSOL Multiphysics simulation that yields multiple results, there are specific ways to postprocess the data. Using a simple parametric sweep study, we show you how to tabulate your ...
再生時間: 3:22
How to Import Results Data into COMSOL Multiphysics
When a simulation has numerous data points, you can compare your results with reference or experimental data directly within the COMSOL Multiphysics graphical user interface. In this video, we ...
再生時間: 8:06
How to Use Surface, Volume, and Line Plots to Visualize Your Results
COMSOL Multiphysics® contains many tools for postprocessing and visualizing your simulation results. Among the many plot types available are Surface, Line, and Volume plots.
Surface plots are used ...
再生時間: 5:05
How to Use Arrow Plots to Visualize Your Results
Arrow plots are a powerful postprocessing tool used to visualize field distributions in COMSOL Multiphysics®. This is useful for fluid flow, electricity and magnetism, chemical, and heat transfer ...
再生時間: 6:31
How to Use Slice Plots to Visualize Your Results
Slice plots are a postprocessing tool that can be applied to your COMSOL Multiphysics simulations that are modeled in 3D. You can use a Slice plot to display a quantity on one or more cross ...
再生時間: 7:11
How to Use Contour and Isosurface Plots to Visualize Results
Contour and Isosurface plots are used in postprocessing to visualize scalar quantities and fields in your simulation results. Contour plots display your results on a series of colored regions or ...
再生時間: 5:02
How to Use Streamline Plots to Visualize Your Results
Streamline plots are a postprocessing tool in COMSOL Multiphysics® that can be applied to the results of 2D and 3D models. You can use a Streamline plot to display a vector quantity, which is ...
再生時間: 5:39
Using the Graphics Window to Customize Model Visualizations
In COMSOL Multiphysics®, the Graphics window provides you with interactive graphics for the geometry, mesh, and results of your model. In addition, the Graphics window toolbar provides you with the ...
再生時間: 1:01:49
Postprocessing and Visualizing COMSOL Simulation Results
In this archived webinar, learn how to postprocess and analyze your numerical simulation results in COMSOL Multiphysics®. We demonstrate how to evaluate data along lines and surfaces; compute derived ...
再生時間: 32:45
Using Plots to Visualize Results in COMSOL Multiphysics®
Watch this video series to learn how to create some of the most frequently used plot types in COMSOL Multiphysics®. Each video shows a step-by-step demonstration of how to create certain plot types and the ...