- COMSOL News 2025
- COMSOL News Special Edition: Food Industry
- COMSOL News 2023
- COMSOL News 2022
- COMSOL News 2021
超音波トランスデューサーで石油ガス抽出の品質基準を達成
Baker Hughes 社は, 3D超音波シミュレーションを用いて音波伝播を解析しており, 実験応答の捕捉, 抽出した石油ガスの試験に使用するトランスデューサーの最適化を通して試作コストを 30% 削減しました.
Mackenzie McCarty 著
2025年9月
石油やガスが住宅の暖房, 自動車の燃料, 発電に使用されるようになるまでには, 精製, 輸送, 抽出, 試験といった広範なプロセスを経ます. Baker Hughes 社は, このプロセスの最初の段階, つまり上流段階, 特にセメント結合検層技術を用いてガスの品質を評価することに注力しています. 同社は, 抽出した石油とガスの試験で一般的に用いられる2つの方法, パルスエコー試験とピッチキャッチ試験に使用する超音波トランスデューサーの設計と改良に, マルチフィジックスシミュレーションソフトウェアを活用しています.
石油とガス採掘の探査
上流工程でガスを採掘するために坑井を掘削する際, 坑井内の流体の流れを制御するために坑井を補強する必要があります. セメント結合評価はこの工程において重要な手順です. ボーリング孔を掘削した後, ボーリング孔内の生産帯間の流体の流通を防ぐため, ケーシングと地層の間にセメントを注入します. Baker Hughes 社の主任科学者である Haiqi Wen 氏によると, セメントシースは流体の流通を防ぎ, 地表への流体の流出を遮断する水圧シールを形成します.
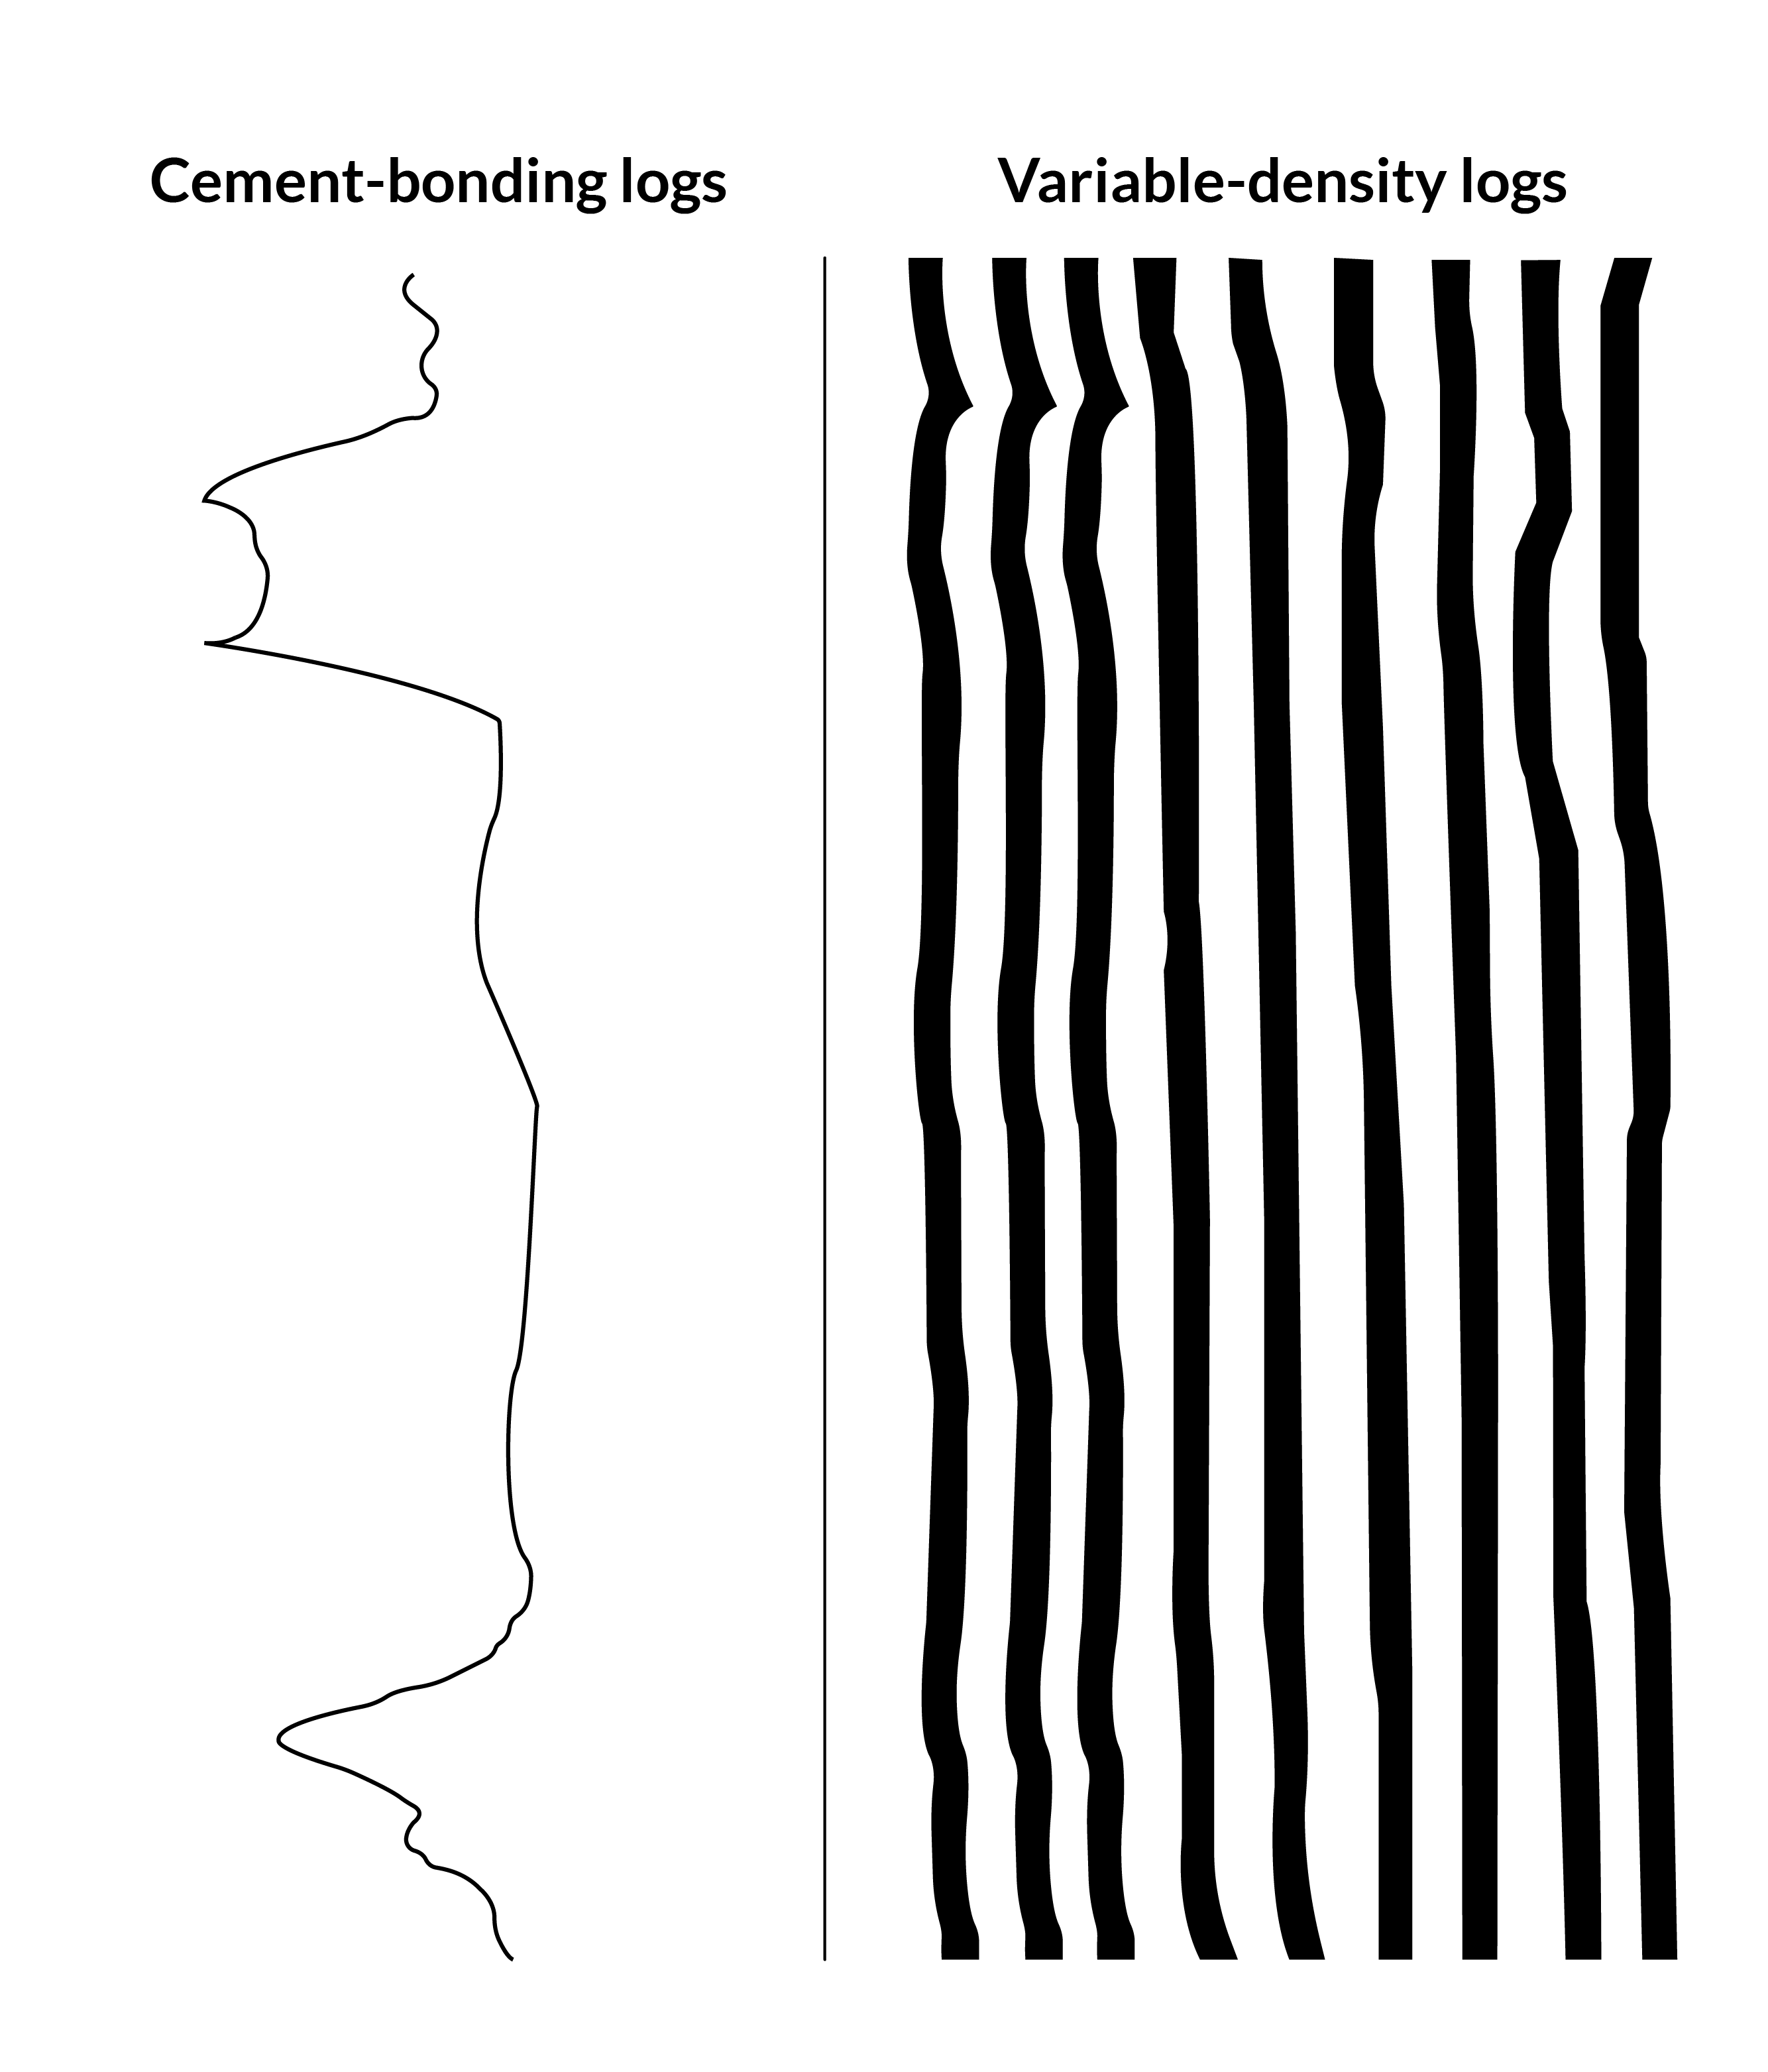
坑井の健全性と流体帯の分離状態を正確に評価するために, ワイヤーラインで坑井に挿入される超音波ツールとしてよく使用される2つのツールは, セメント結合検層 (CBL) と可変密度検層 (VDL) と呼ばれます. CBL の結果は1つの波形として得られ, 波形の振幅と減衰係数に基づいてケーシングとセメント間の結合品質を判定できます. VDL は “すべての波形を視覚的に表現したもののようなもので, 地層とセメントの結合品質に関するより多くの情報を得ることができます” と Wen 氏は述べています (図 1).
抽出地点での石油やガスの試験は, 製品が次の工程に進む前に品質基準を満たしていることを確認するために重要です. この試験によって, 価値や使用性に影響を与える可能性のある不純物を特定できるほか, 組成や生産速度を分析することで生産の最適化に役立つと Wen 氏は説明しました. さらに, この試験によって得られるデータは, オペレーターが貯留層の状態を把握し, 安全上の懸念事項を特定できるように, 将来の改善に活かすための重要な手がかりにもなります.
圧電トランスデューサーは, プロセスの上流, つまり試験部分で使用されます. Wen 氏と彼のチームは, COMSOL Multiphysics® ソフトウェアを使用して圧電トランスデューサーをモデル化しました (図 1). ソフトウェアに組み込まれたマルチフィジックス機能を使用して, 流体と圧電トランスデューサー, 弾性波と圧力音響, 外部電気回路と圧電素子の端子を連成させました. これにより, 複数の物理現象がどのように相互作用するかを正確に検証し, 電圧信号から弾性波への変換, そしてカスタマイズされた回路パラメーターを用いてトランスデューサー境界における流体構造相互作用をモデル化することができました.
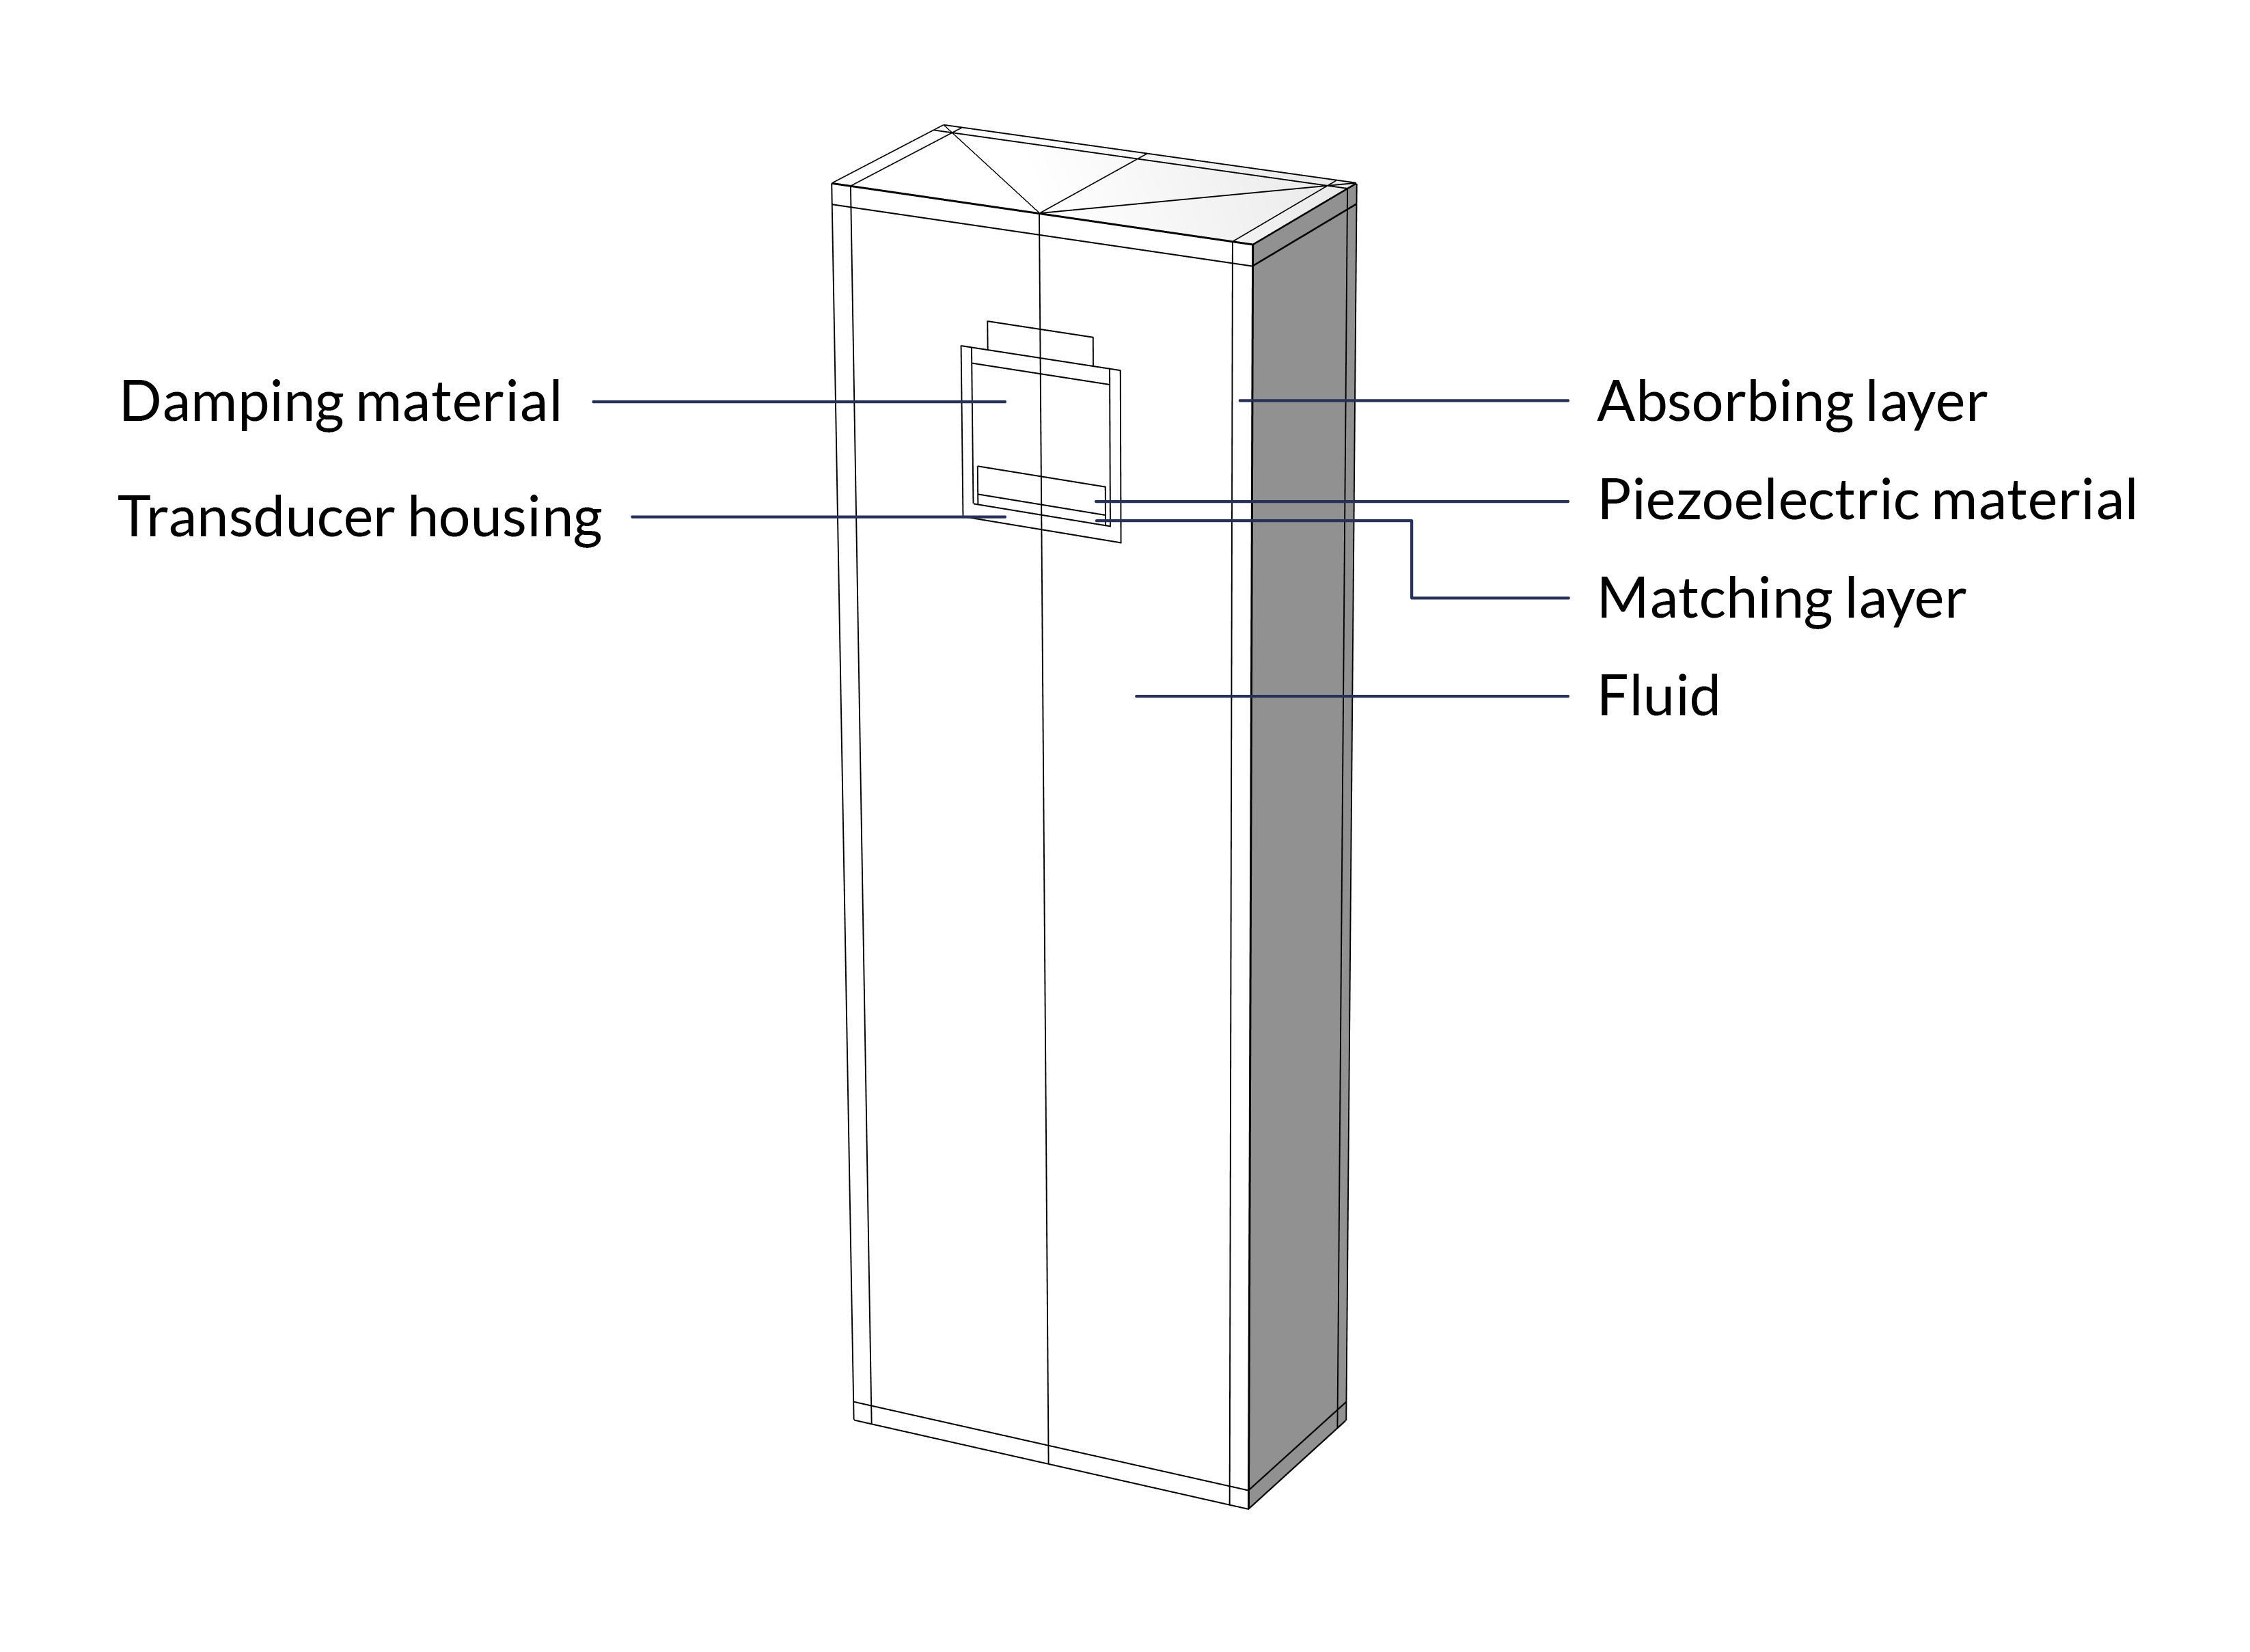
“境界に吸収層を配置して入射波を吸収します” と Wen 氏は述べ, さらに “境界は周波数フィルタリングとスキャン機能も果たします. 時間とエネルギーを節約するため, モデルの8分の1のみをシミュレーションしますが, ミラーリングされたデータセットを適用することで, 完全なモデル応答とデータを得ることができます”.
トランスデューサー設計の重要な要素は, 波長と整合層に対する圧電トランスデューサーの厚さです. この設計では, トランスデューサーの厚さは波長の半分に設定され, 整合層の厚さは波長の4分の1に設定されています.
Wen 氏は, トランスデューサーの寸法とメッシュ設定を構築する際に, アセンブリと一体化という2つの異なる手法を検討しました. アセンブリは界面に不連続なメッシュを作成しますが, 一体化は連続したメッシュを作成します. “一体化は通常, より堅牢性が高いと思いますが, 界面に非常に細かい要素を配置するため, 場合によってはシミュレーションがわずかに遅くなる可能性があります” と Wen 氏は述べています.
シミュレーションによるプロトタイピングコストの削減
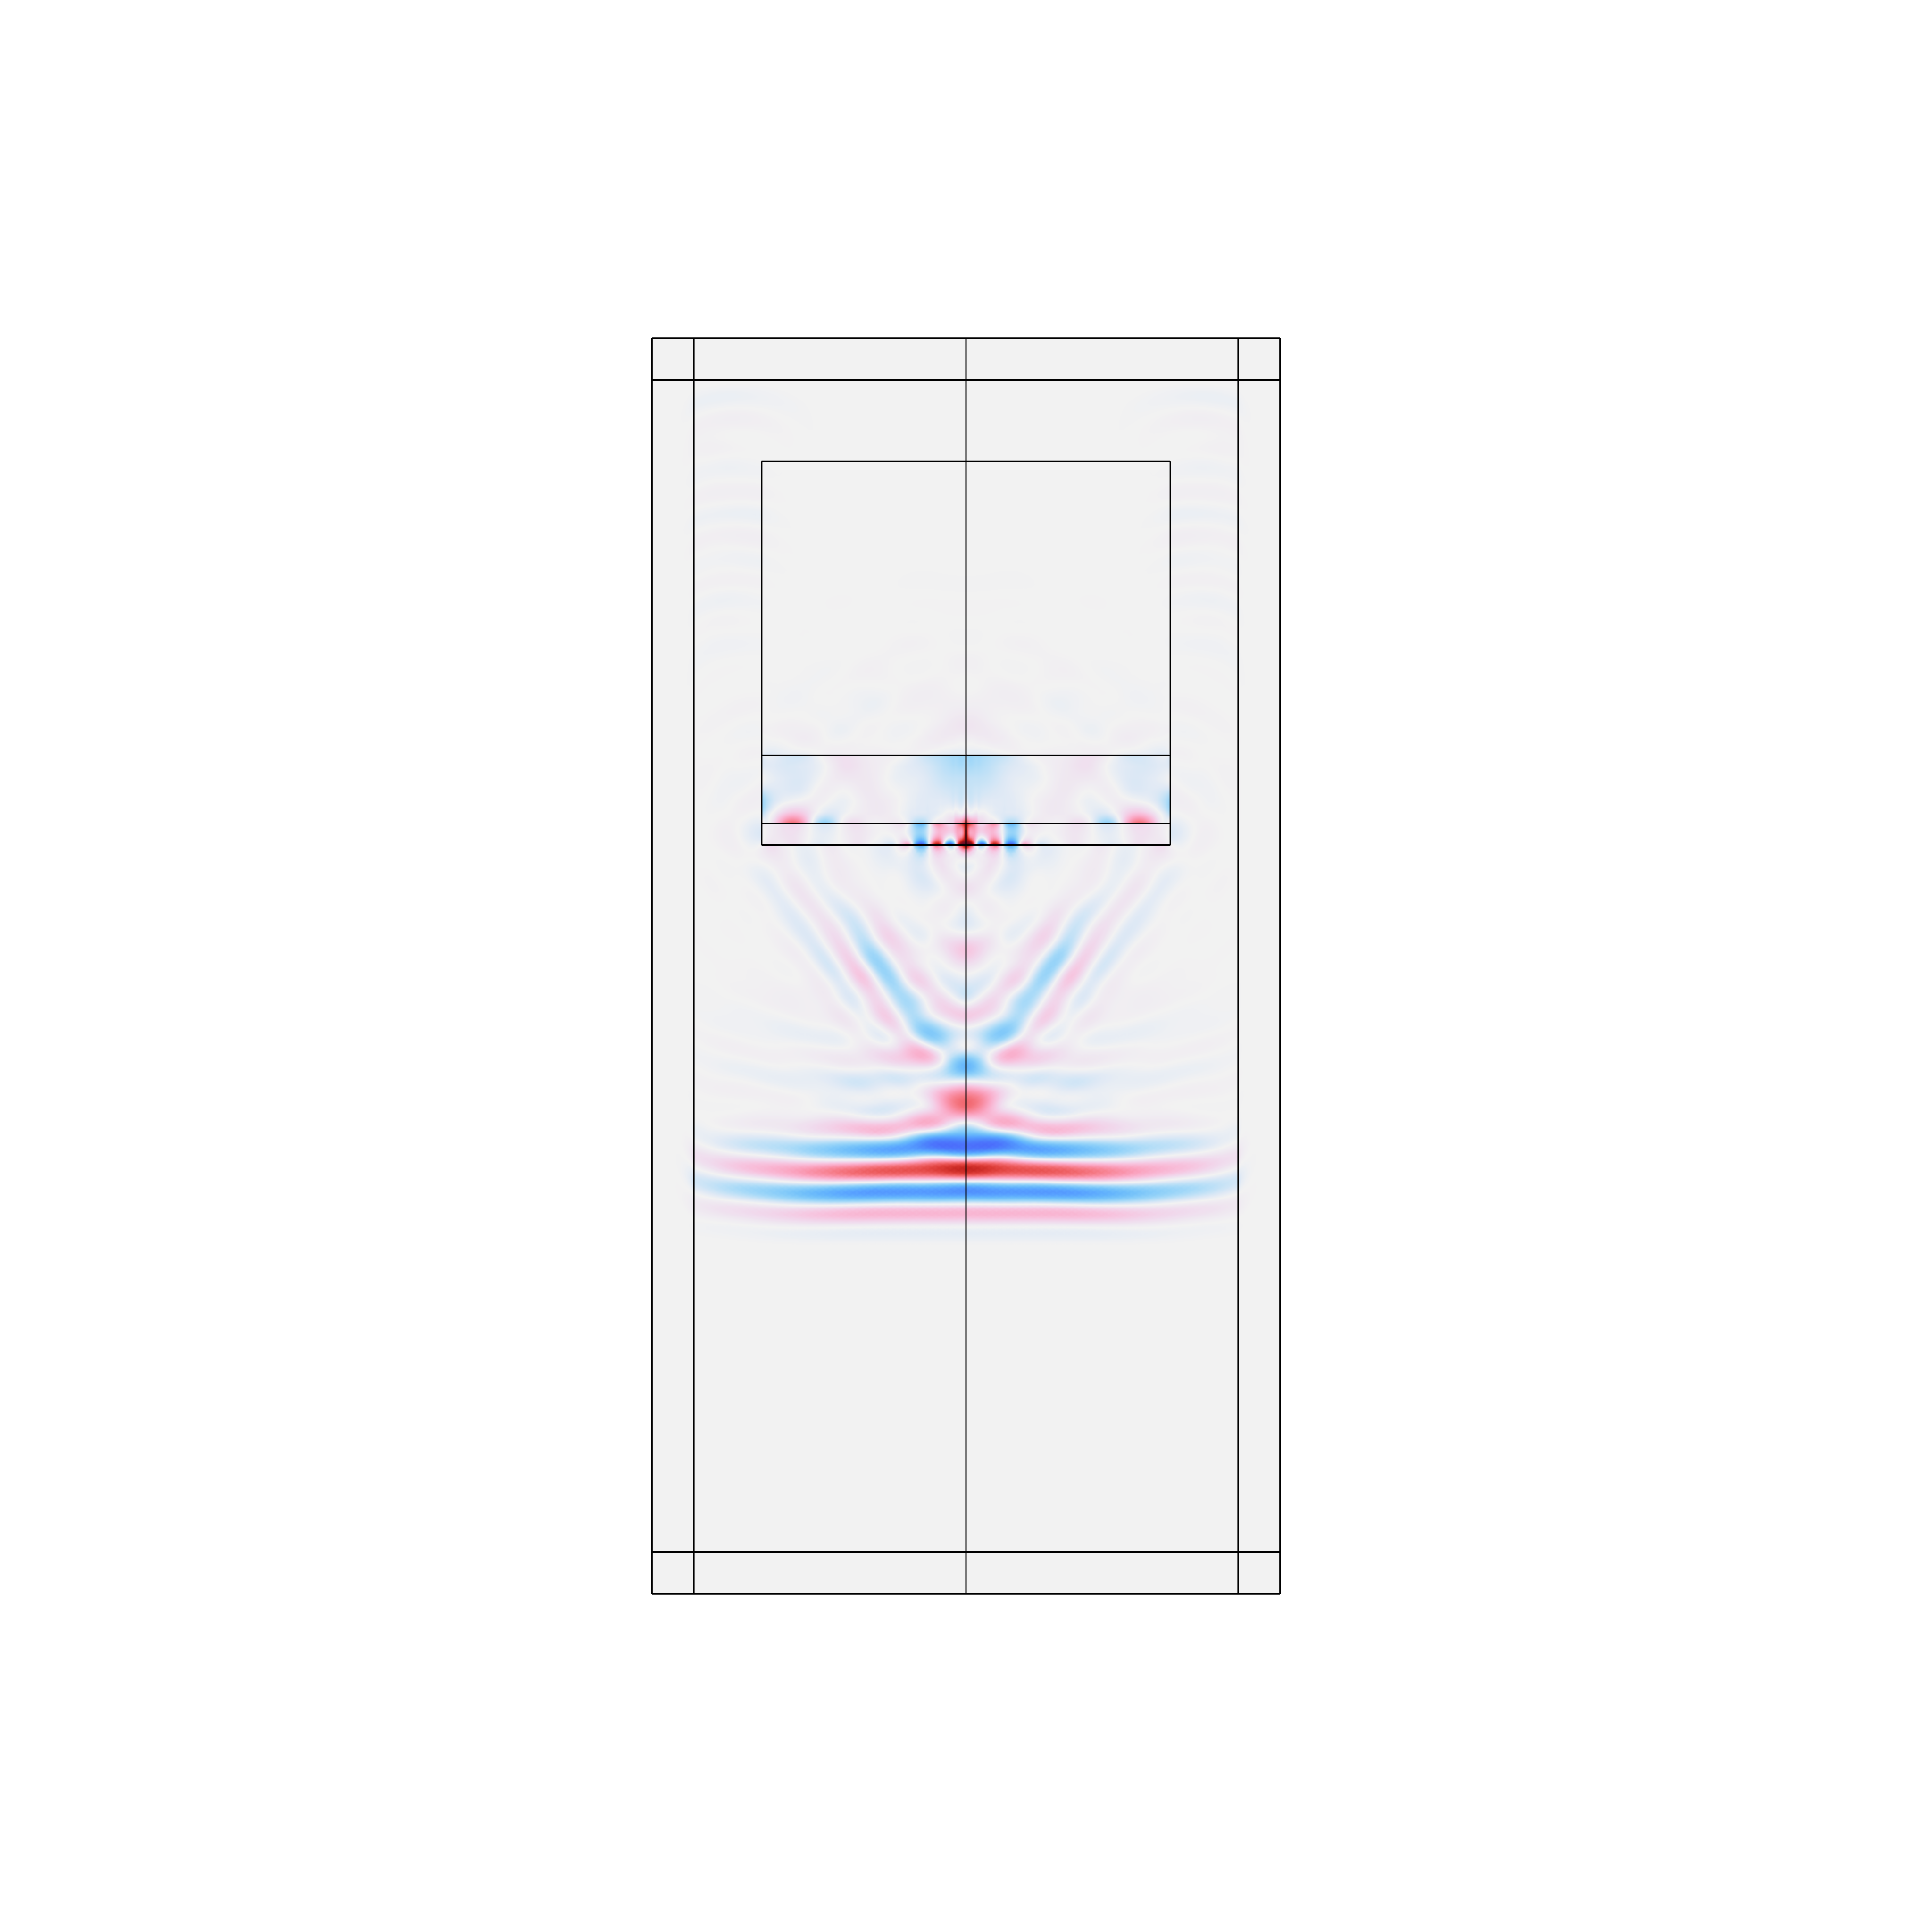
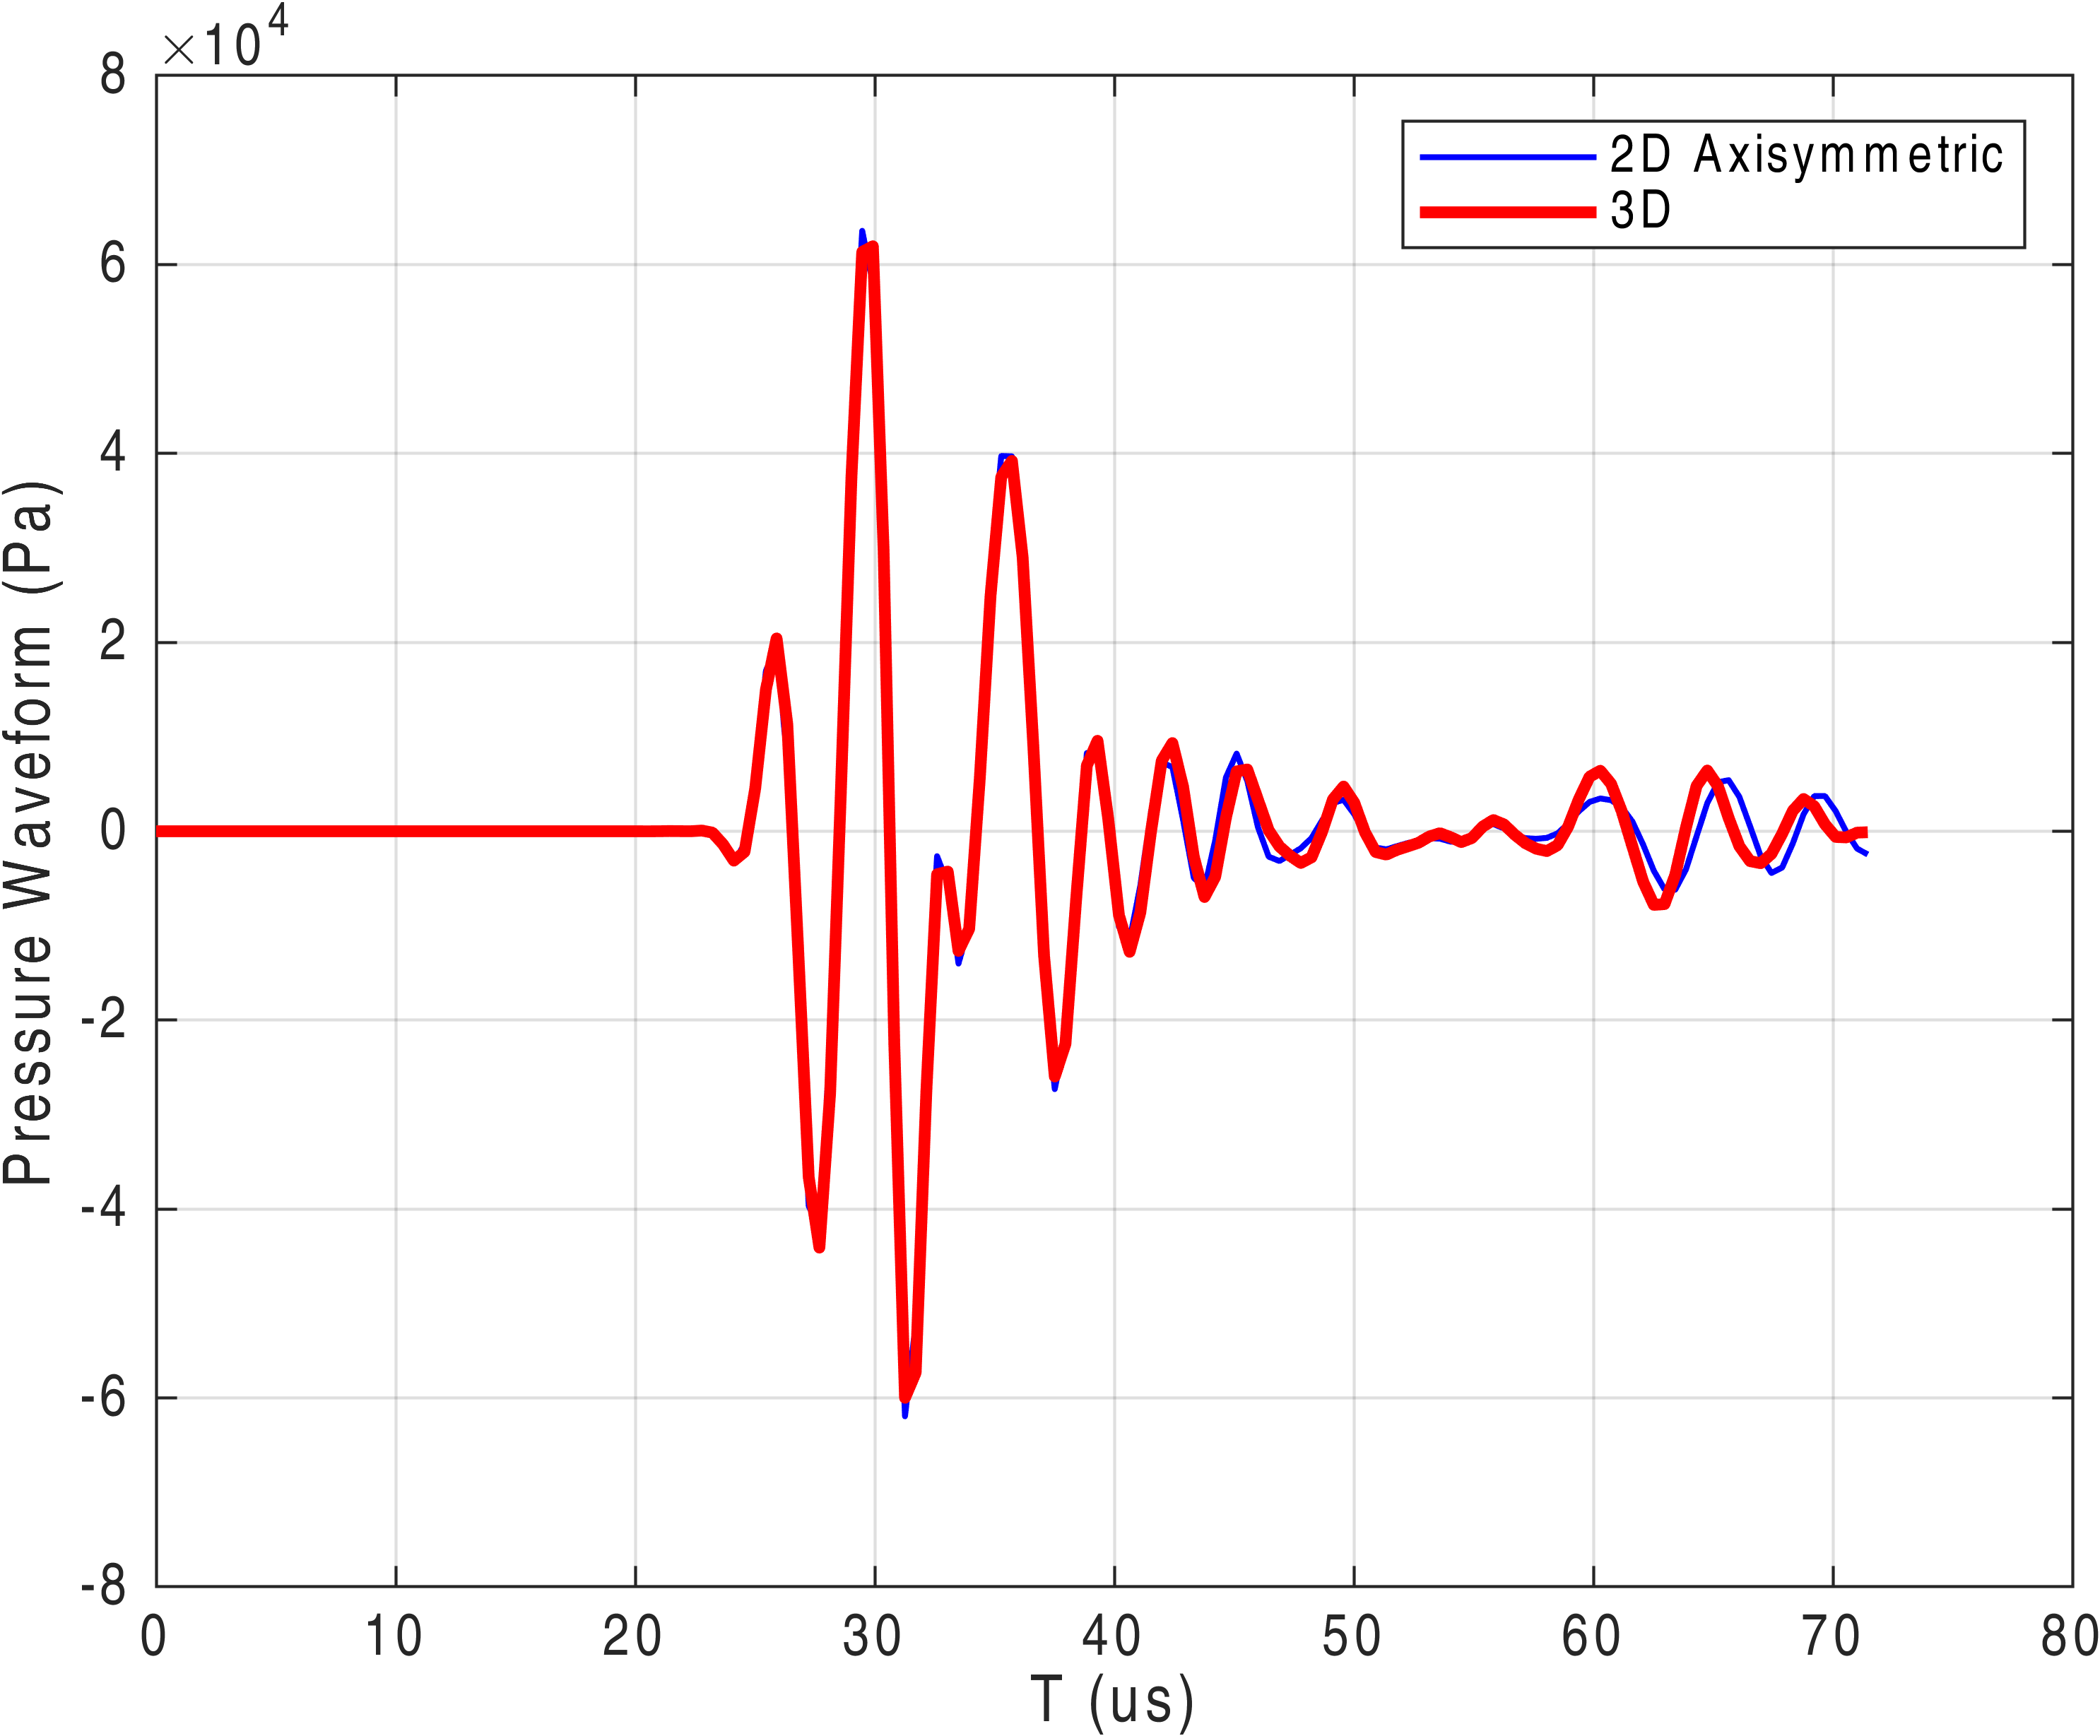
Wen 氏は, 簡略化された軸対象の2Dトランスデューサーモデルと完全な3Dモデル (図 3) を構築し, 両方のモデルを実験テストで検証しました. シミュレーションでは, 井戸のセメント表面に短いパルス信号を送信します. 接合品質が良好な場合, 材料はすべてしっかりと接合されており, 間に空隙や亀裂がないため, 受信機は強い信号をあまり表示しません. このシナリオでは, 信号は表面を通過します. 逆に, 接合品質が悪い場合は, 信号が亀裂や空隙に当たるため, 受信機は反射信号を表示します.
“この研究では, 波動伝播と圧力応答を比較しました. ご覧の通り, 波動伝播はほぼ同じです” と Wen 氏は述べています. さらに Wen 氏は, モデルが軸対称であれば2Dモデルを使用してシミュレーション結果をより高速に得ることができますが, そうでない場合は3Dモデルを使用する必要がありますと説明しました.
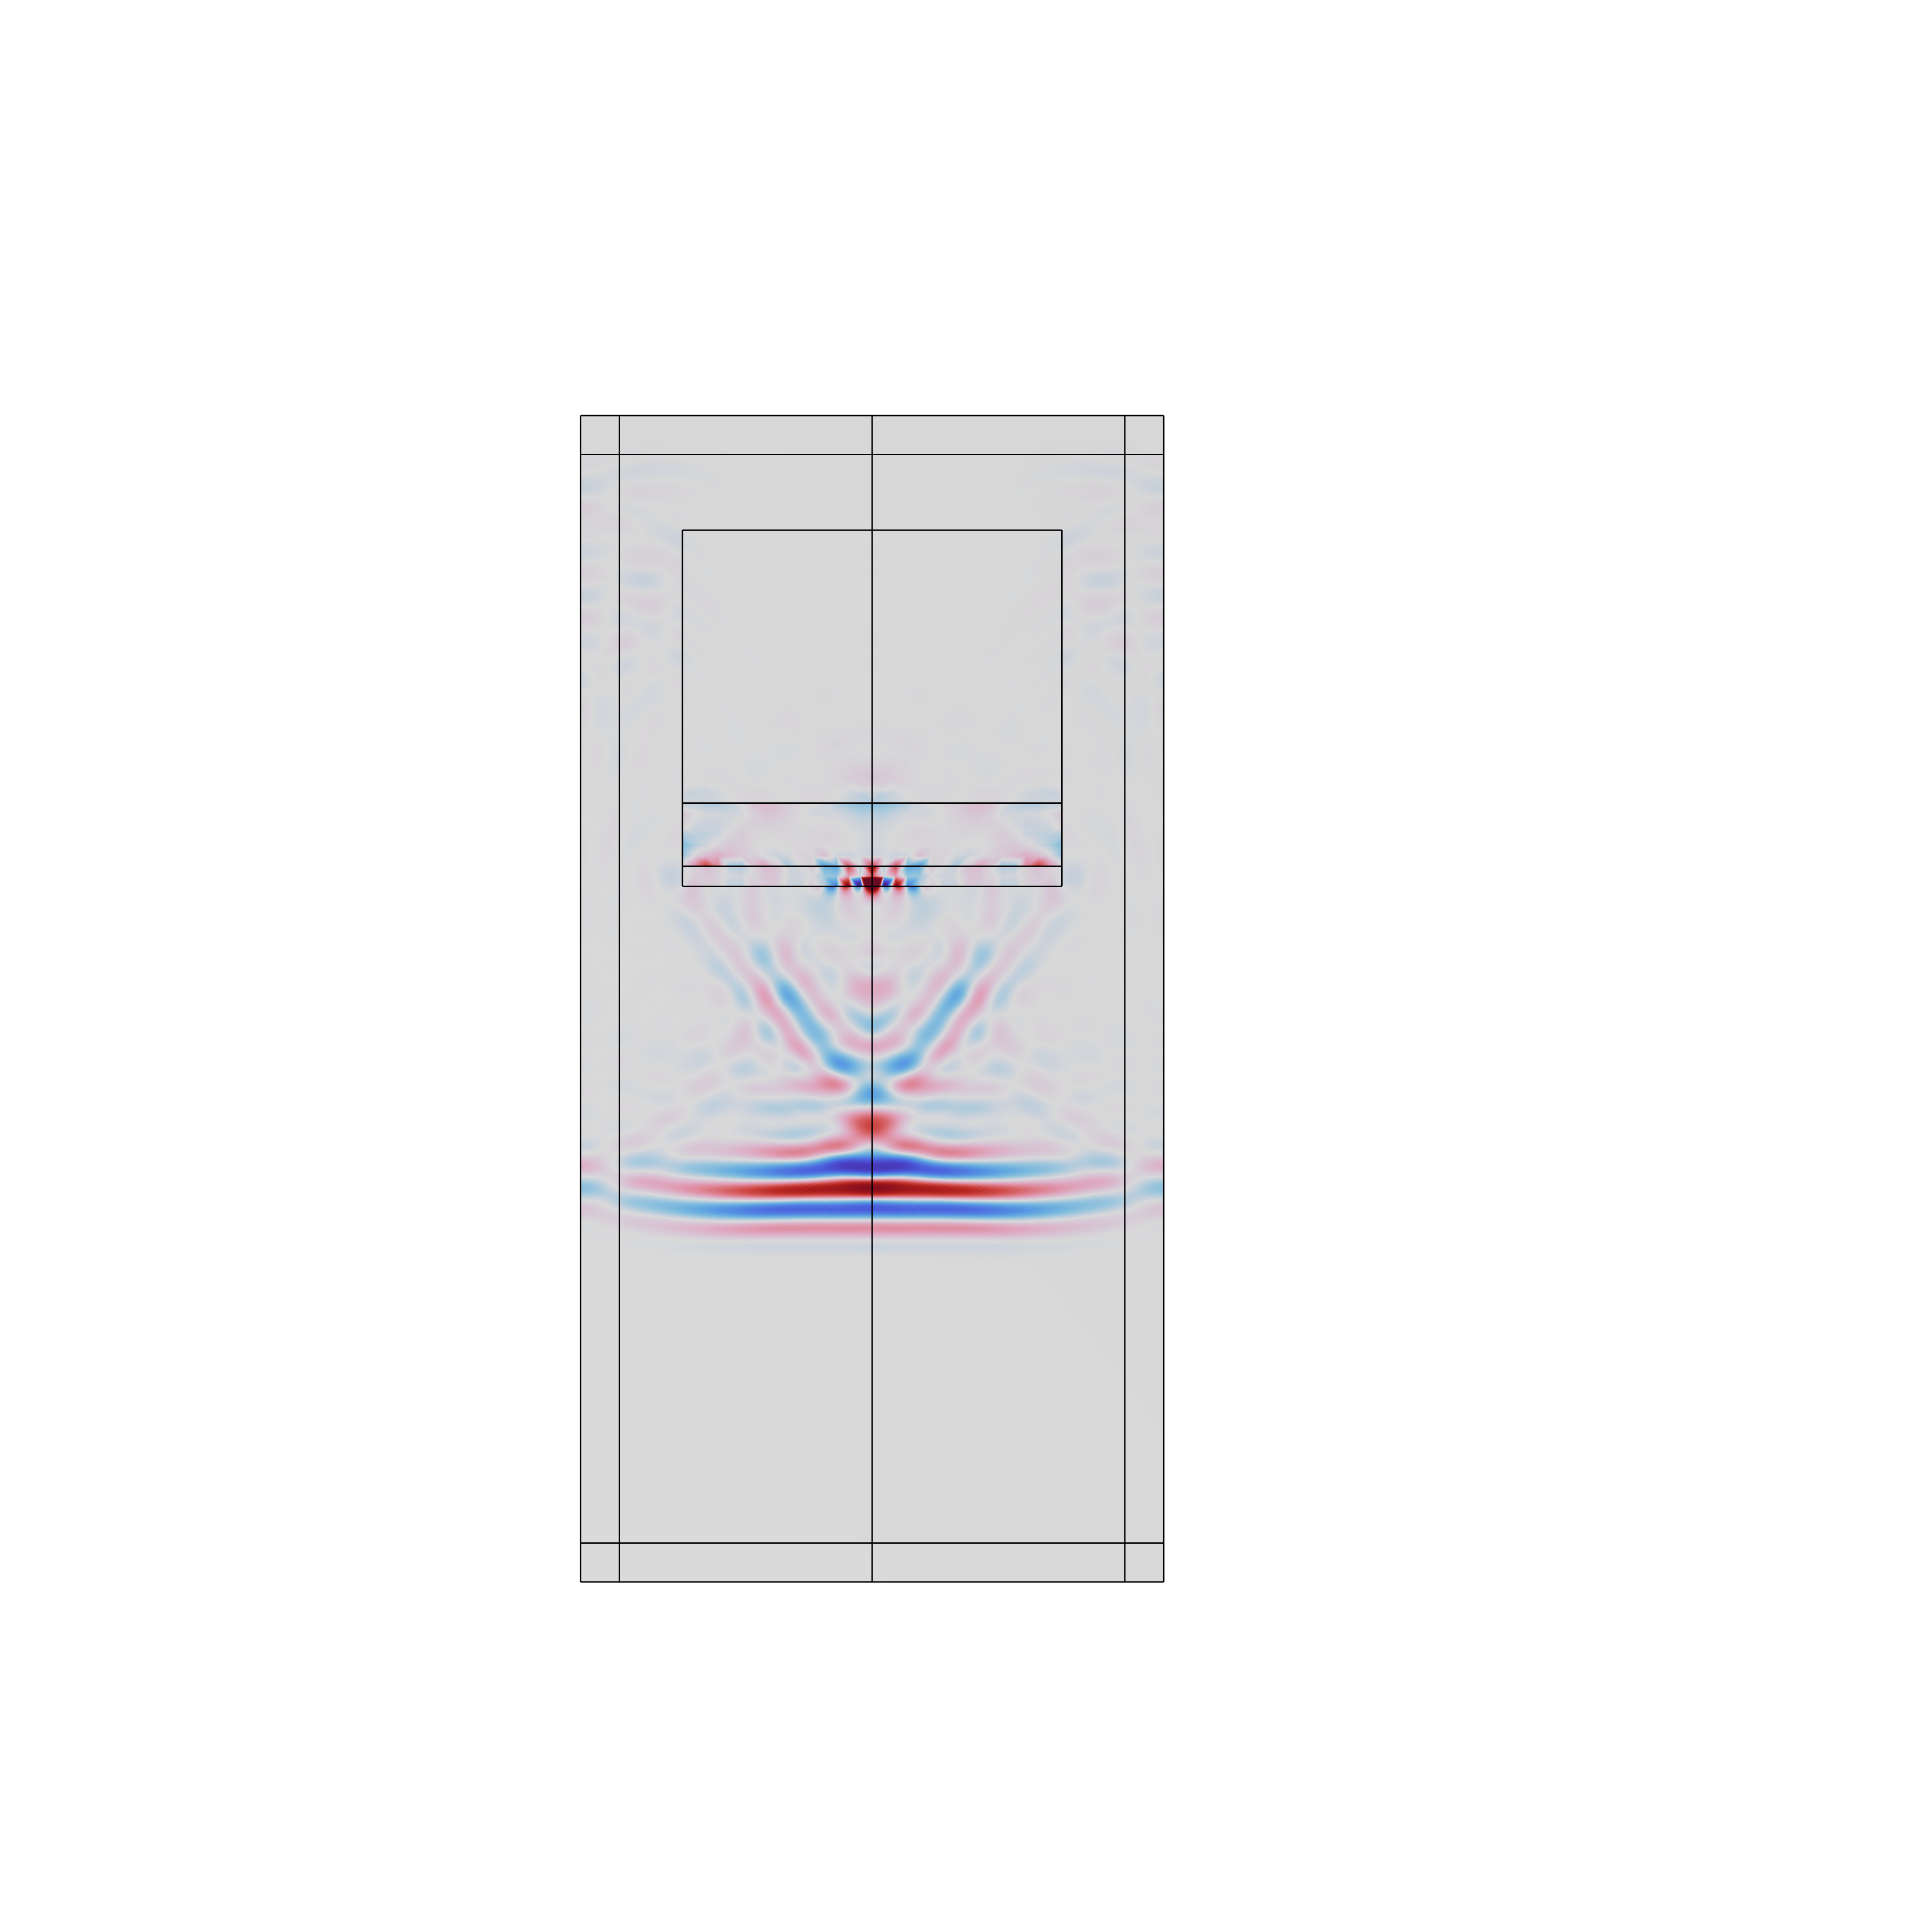
3Dモデルの結果は, x = 0 (図 3の右側に表示) の yz 断面における圧力応答を評価することで得られます. “この圧力プローブの応答では, 2Dモデルは3Dモデルとほぼ重なっています” と Wen 氏は述べました. 彼は, COMSOL Multiphysics® ソフトウェアと MATLAB® ソフトウェアを接続するインターフェース製品である LiveLink™ for MATLAB® を使用して結果を比較しました (図 4).
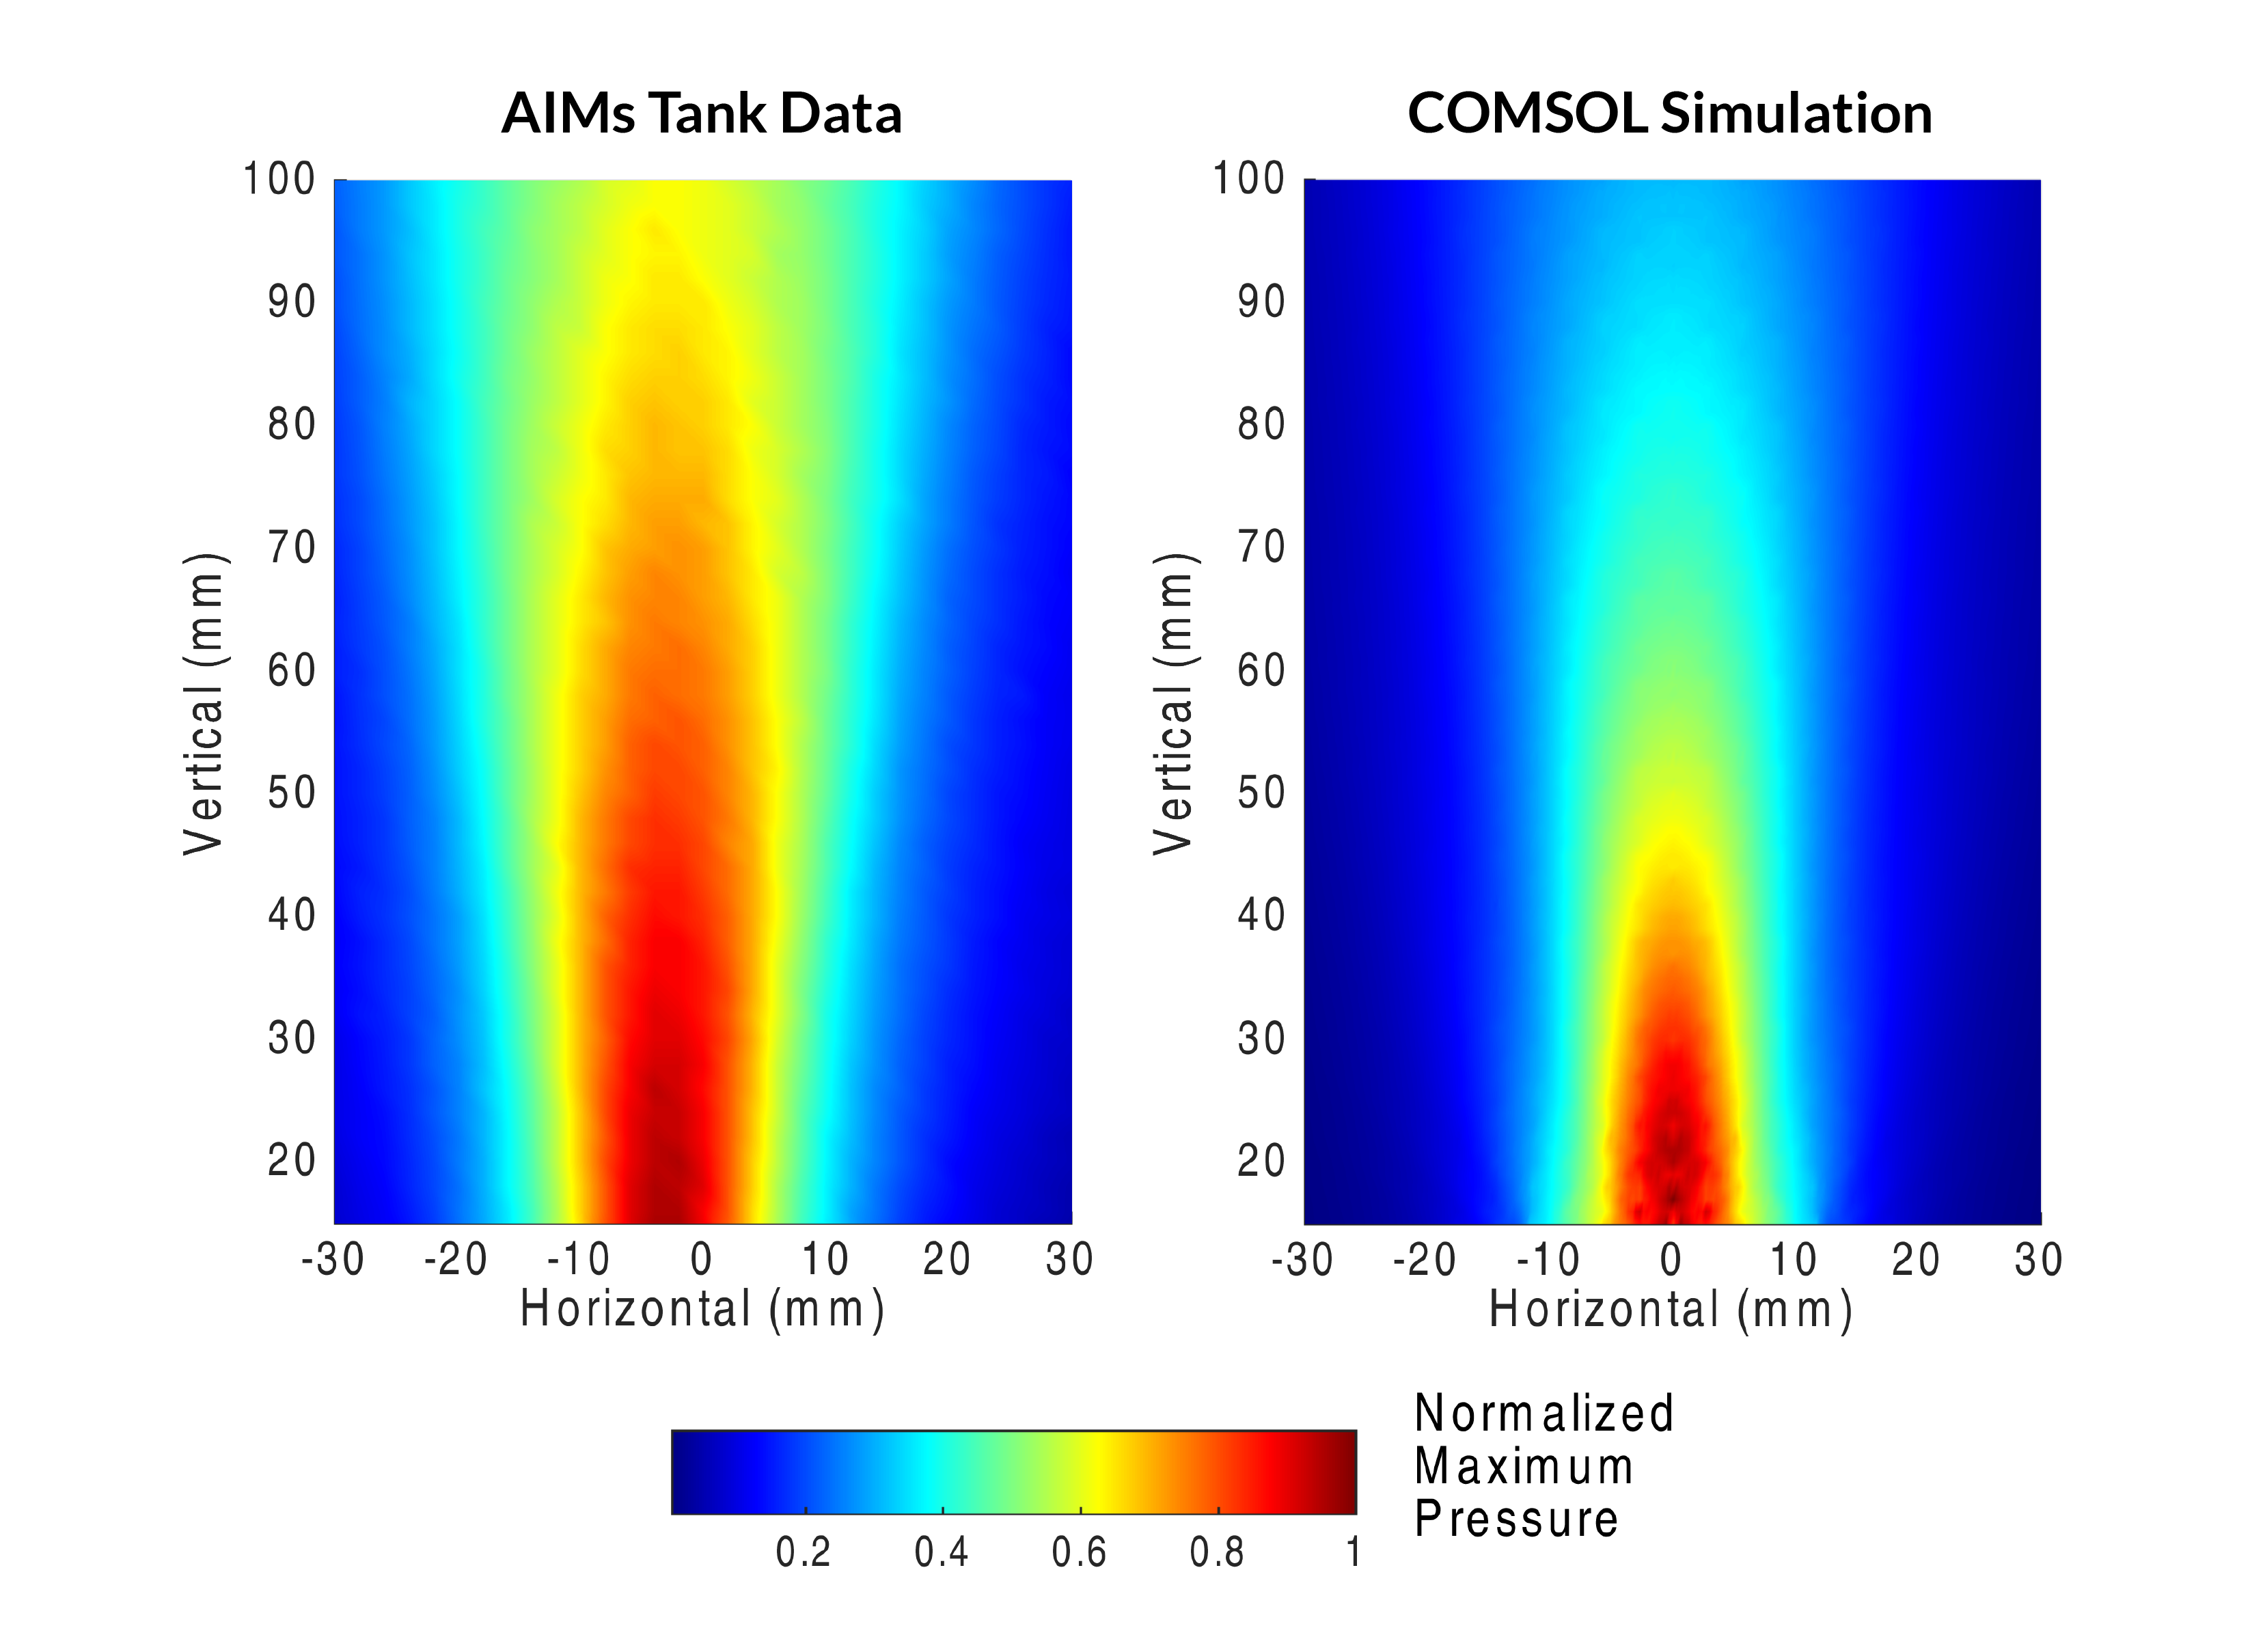
COMSOL のシミュレーション結果と測定データは, LiveLink™ for MATLAB® を介して示されているように, 近傍場でよく一致しています (図 5). 結果は, 最大圧力が軸上にあり, このデータにおけるトランスデューサーの中心周波数は 280 kHz の振幅であることを示しています. しかし, Wen 氏が指摘したように, “解決に取り組んでいる矛盾点がいくつかあります”. その一例として, 測定データにはサイドローブが存在するのに対し, シミュレーション結果にはそれが見られなかったことが挙げられます. もう一つの矛盾点は, シミュレーション結果では局所的な打ち消しが観測されるのに対し, 測定データは連続的な減衰を示していることです.
“実際のアプリケーションでは圧電材料は複合材料であるため, この問題は圧電材料のモデリングに関連している可能性があります. しかし, 現在の研究では均質材料として扱っています” と Wen 氏は述べ, “現在も改善に取り組んでいます” と続けました.
“全体として, シミュレーションによって試作コストを約 30% 削減できました” と Wen 氏は述べました. “以前は, 新しいトランスデューサーを注文する必要がある場合, 通常は仕様の異なる複数のトランスデューサーをまとめて注文していました. しかし, COMSOL® のようなシミュレーションソフトウェアを使用するようになった今では, バッチの中に良い設計がいくつかあることを確認するだけで済みます. 新しいトランスデューサーの設計をすべて注文して, どれが最も優れた性能を発揮するかをテストするのではなく, それらの設計を注文するだけで済みます” と Wen 氏は述べています.
パルスエコー法とピッチキャッチ法
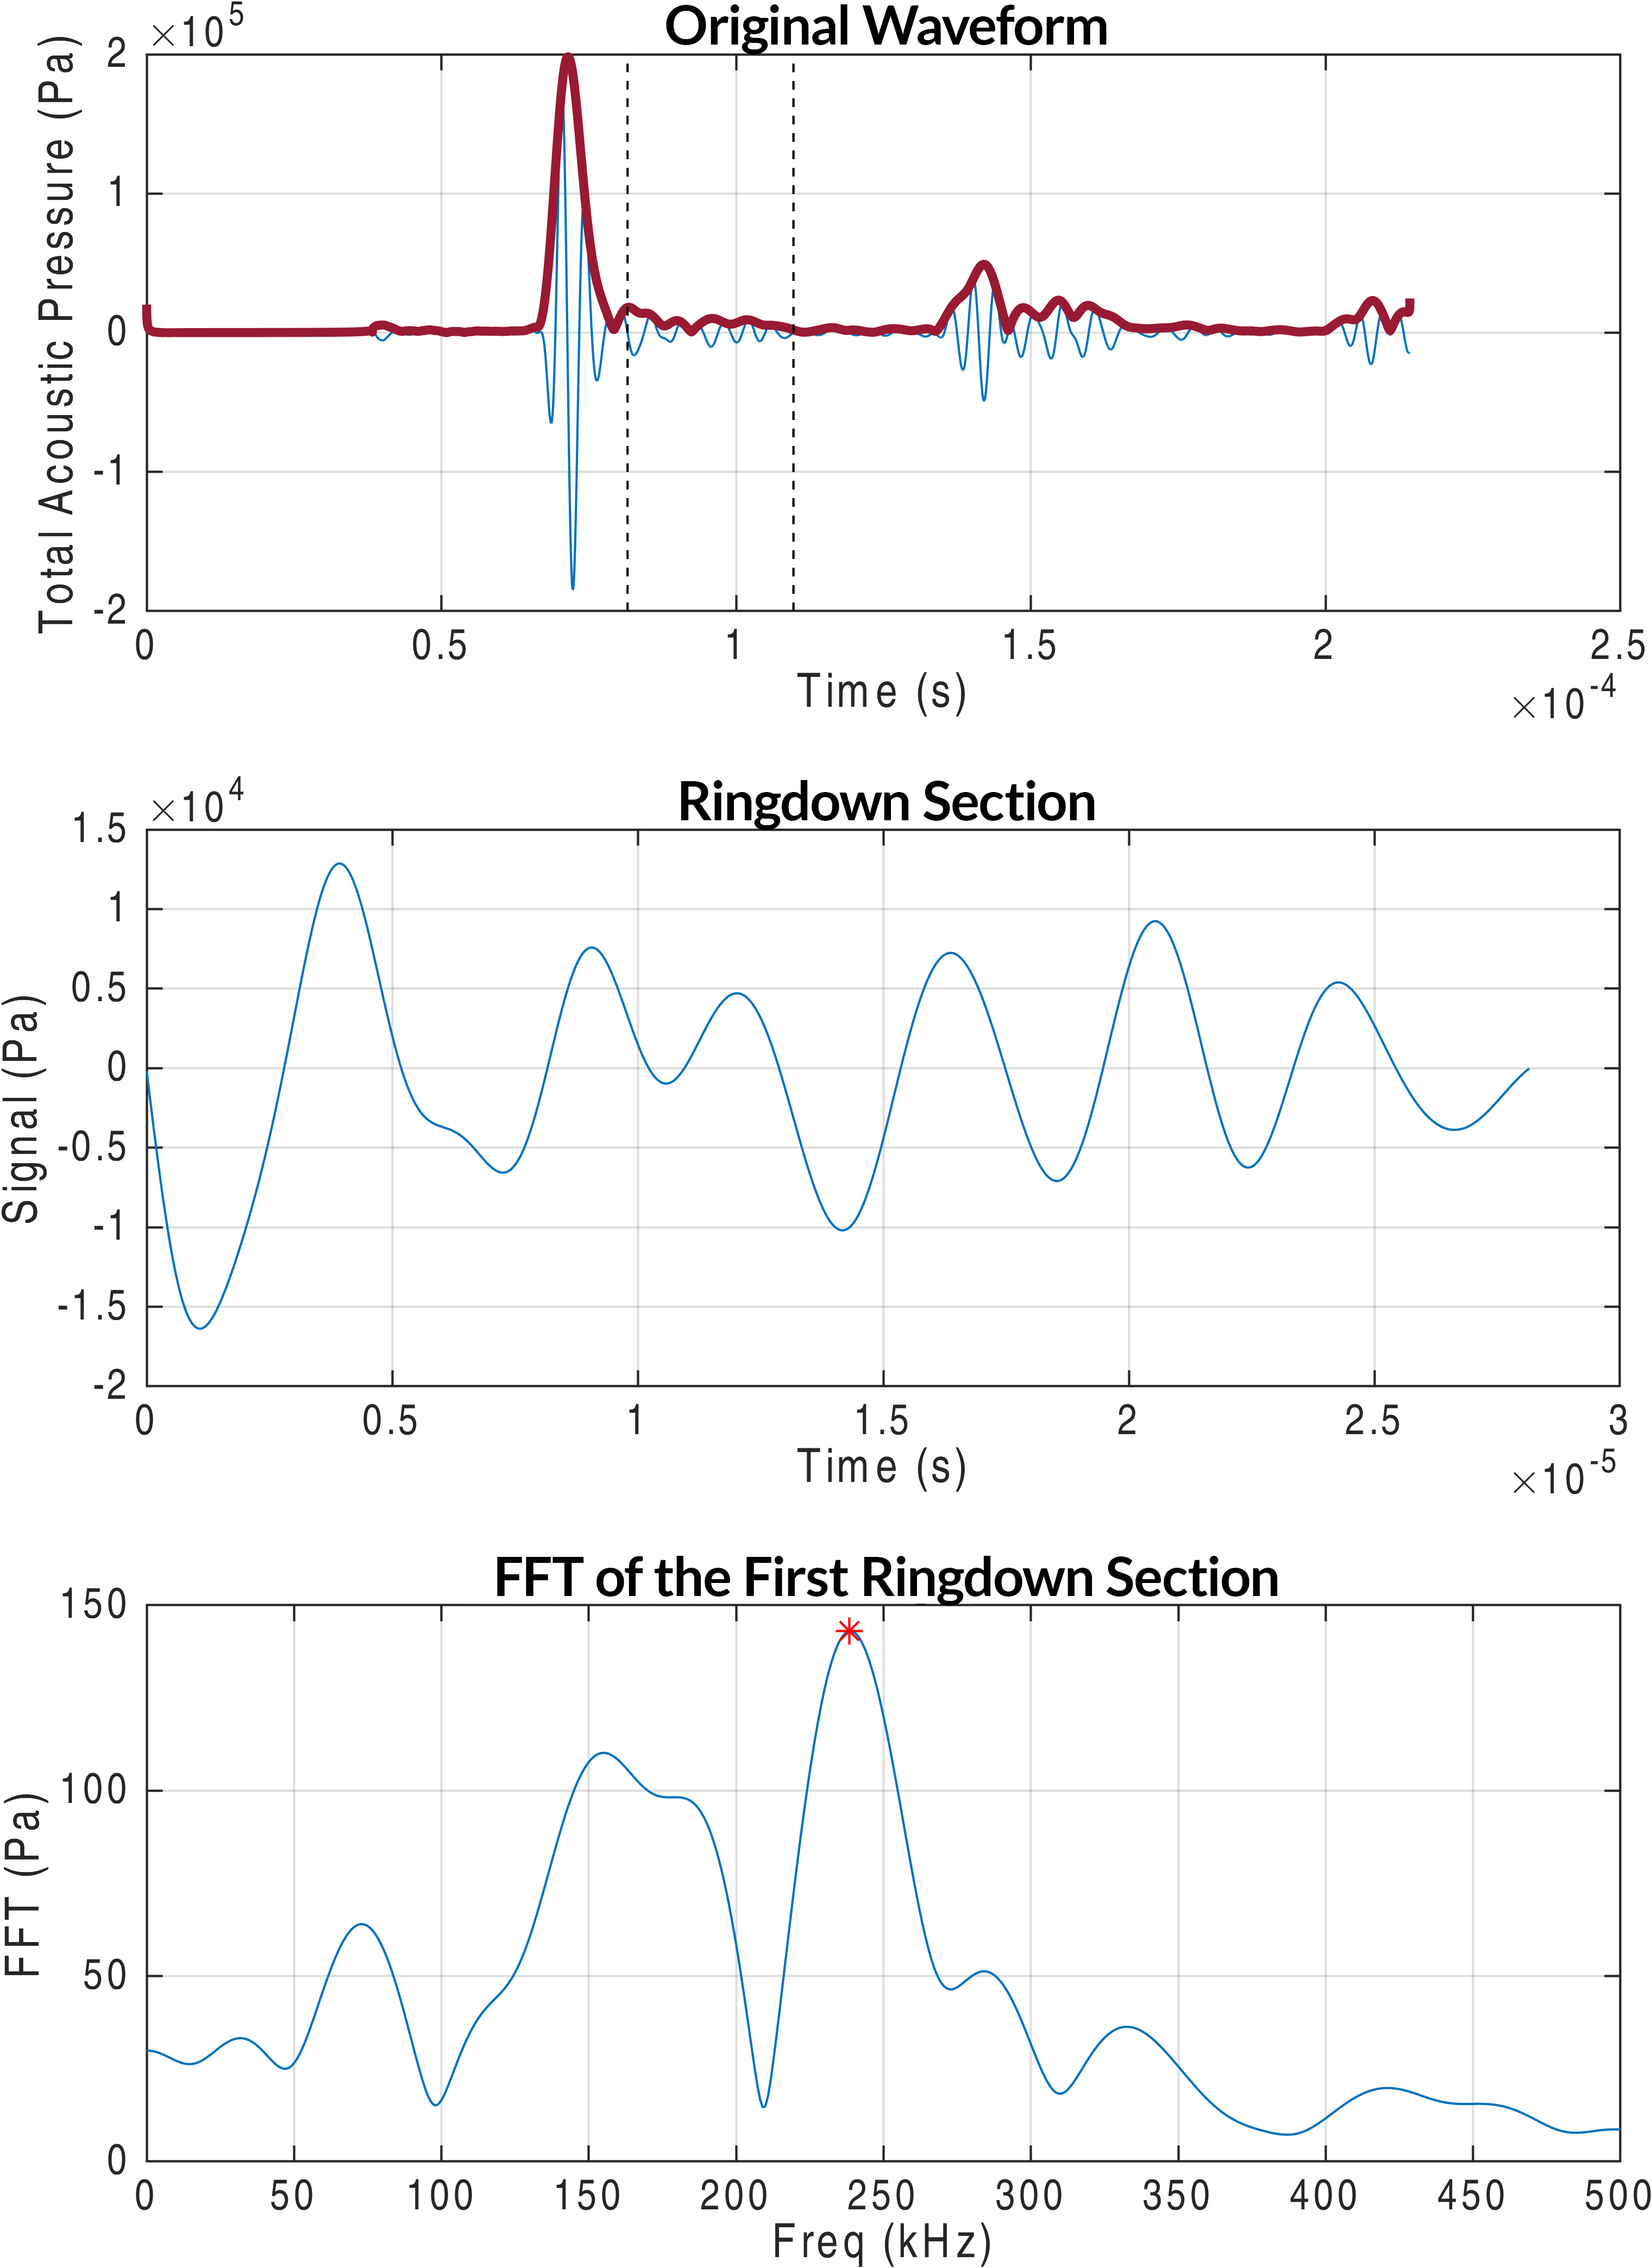
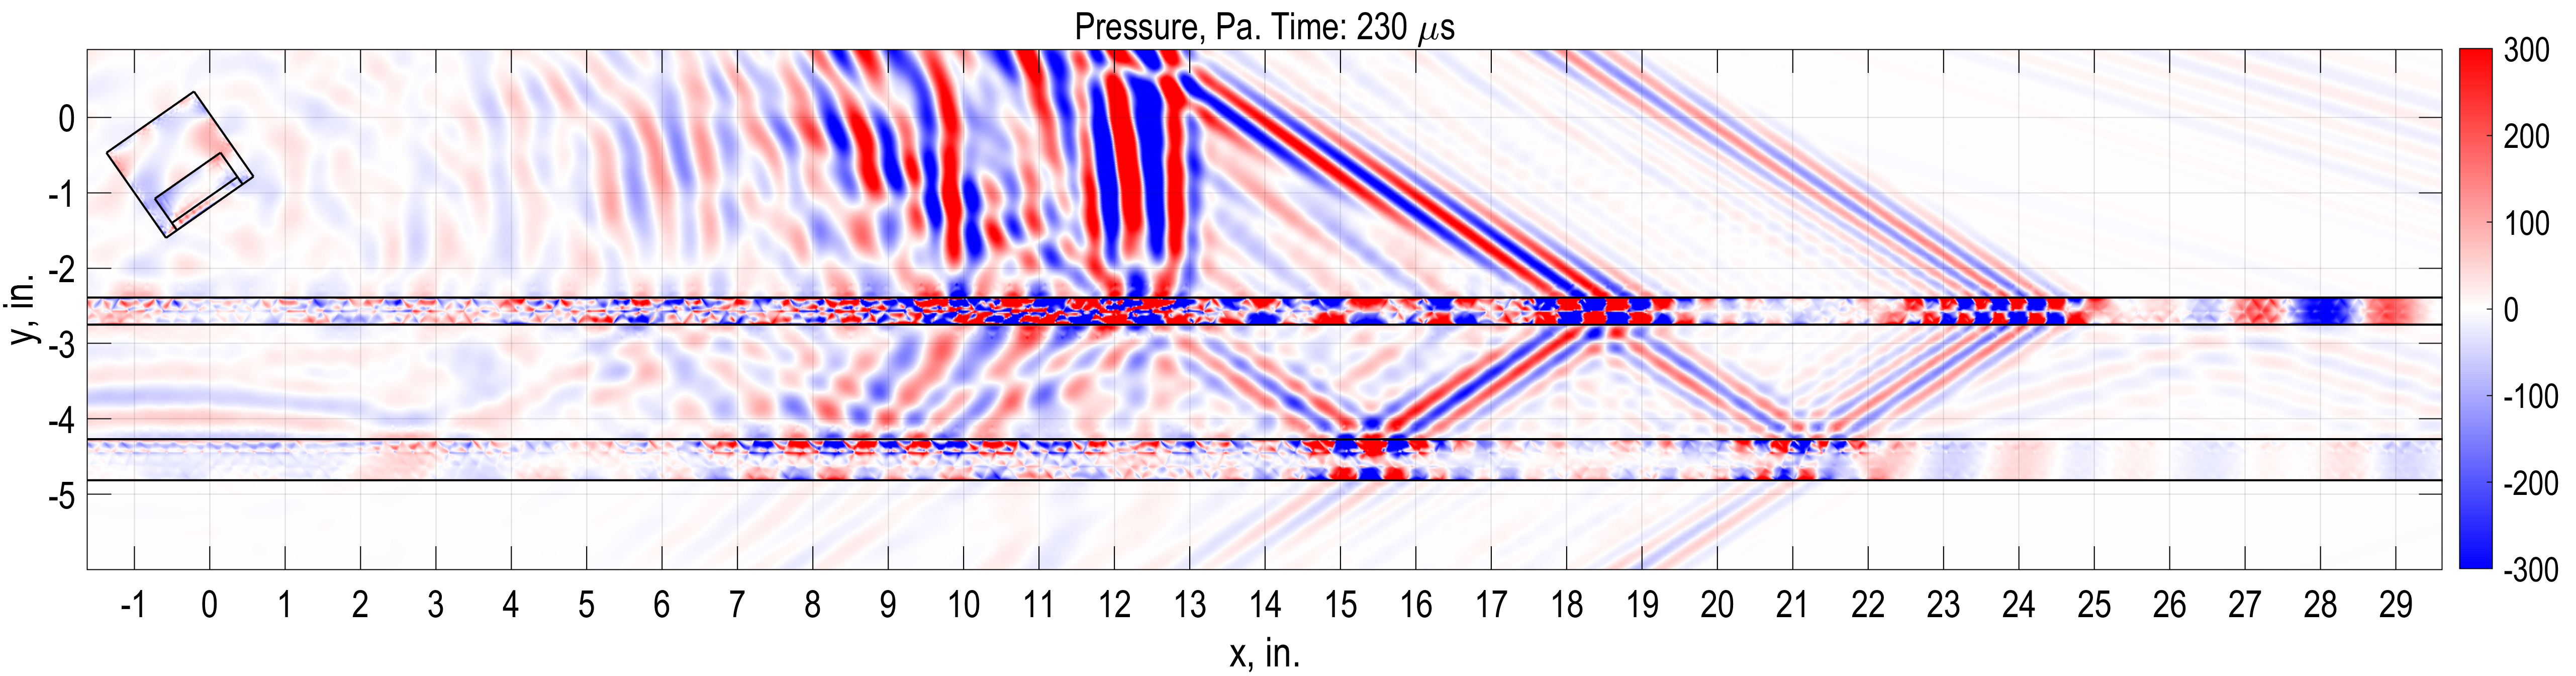
研究をさらに進めるため, Wen 氏とチームは COMSOL Multiphysics を用いてパルスエコー試験とピッチキャッチ試験のシミュレーションと最適化を行いました. パルスエコーシミュレーションは, 超音波パルス波を発信して材料の欠陥を特定し, 反射波形から情報を得たりできる超音波非破壊検査 (NDT) 技術に焦点を当てています. Wen 氏とチームは, トランスデューサーが送信機と受信機の両方の役割を果たしながら, 金属製の筐体で反射された波を発信しました. 波形データは, ポイントプローブで測定した後, 分析することができます.
Wen 氏はヒルベルト変換を用いて波形エンベロープを抽出します. そして, “FFT (高速フーリエ変換) を適用することで周波数ピークの1つを取得できます. このピークは, 筐体内部の反射に対応しています. 信号を送信すると最初の反射が発生しますが, 実際には内部反射が存在します” (図 6) と Wen 氏は説明します. 筐体の測定値は, 周波数に基づいて計算できます.
ヒルベルト変換は, ピッチキャッチ試験において波長の包絡線を抽出するためにも使用でき, ピークの振幅を追跡することができます. 本研究におけるピークは, 図 7 の特定の点に青と赤の点で示されています. Wen 氏は, 波の振幅をトランスデューサー間隔の関数としてプロットし, 指数曲線を当てはめました (これは図 7 には示されていません). 彼は, 自由管水と発泡セメントの異なる結果を比較することで, 領域内の材料特性を理解しました.
“課題は, かなり低い振幅のピークが見られることです. 実際のアプリケーションでは, 特に高周波数になると, 当然ながら信号対雑音比が低下するため, 非常に困難になります” と Wen 氏は述べています. 彼は, 音波の送受信が非常に高速になると, 意味のある信号を捕捉することが難しくなると説明しています.
COMSOL Multiphysics で2つの試験方法をシミュレーションすることで, 超音波パルス波からのデータ収集効率が向上し, トランスデューサーをモデル化することで, 設計を最適化しながらリソースを節約できます. シミュレーションは, Wen 氏と彼のチームが波が様々な物質をどのように伝播するかを解明し, 最終的な波形の要因を突き止めるのに役立ちます. “これは, 試験実験では得られない情報をシミュレーションが提供できる真の力です” と Wen 氏は説明します. 最終的に, これは Baker Hughes 社が石油とガス生産プロセスの上流工程における効率と精度を向上させるのに役立ちます.
参考文献
- C. Fang et al., "A Novel Cementing Quality Evaluation Method Based on Convolutional Neural Network," Appl. Sci., October 2022; https://doi.org/10.3390/app122110997